-
Demographic Reports
High school jobs research summary. Getting a job as a teenager can be a great way to get some professional experience, save up for college, or earn a little spending money.
Based on our research team’s discovery, Here are some statistics on high school jobs in the U.S.:
Only 30.5% of teens ages 16 to 19 had jobs in 2021.
36.6% of teens 16 to 19 years of age had summer jobs in 2021.
Since 2000, the percentage of teens working summer jobs has fallen from 51.7% to 36.6%.
Since 2000, the percentage of teens working jobs throughout the non-summer months has fallen from 43% to 30.5%.
For further analysis, we broke down the data in the following ways:
Types | Summer Job | Trends and Predictions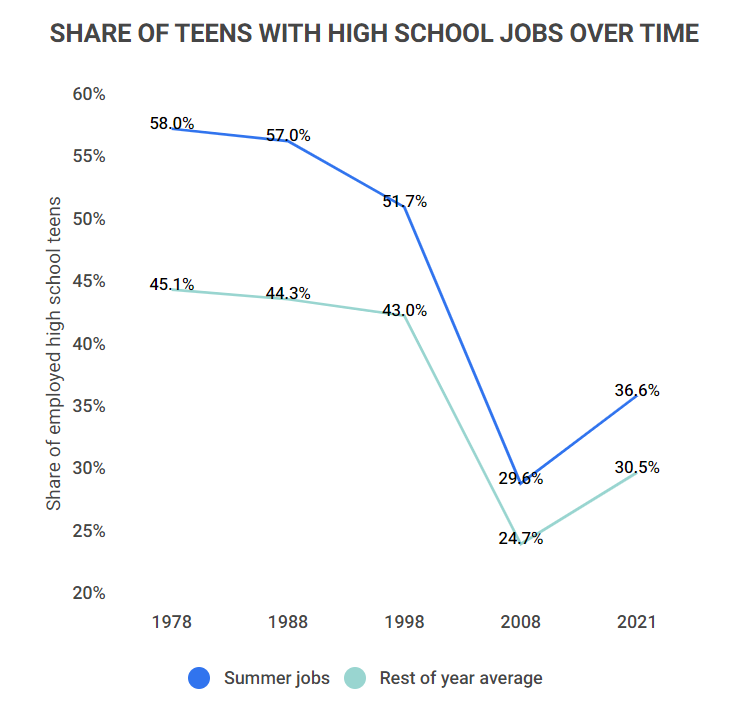
General high school job statistics
The number of teens with high school jobs have been increasing since their lowest point in 2020. However, there are still less teens working today than in 2019. To find out more, here are some general facts about high school jobs in the U.S.:
6 million teens between the ages of 16 and 19 have jobs.
The exact number of teenage employees ebbs and flows throughout the year, so this 6 million is an average representation of the year as a whole. The months of July, August, and September collectively have the most teen workers throughout the year.
Throughout the non-summer months of 2021, an average of 30.5% of teens held jobs.
During the summer months of that same year, 36.6% of teens were employed. Teen employment rates generally increase during the summer since many students who don’t hold jobs during the school year are able to during these months.
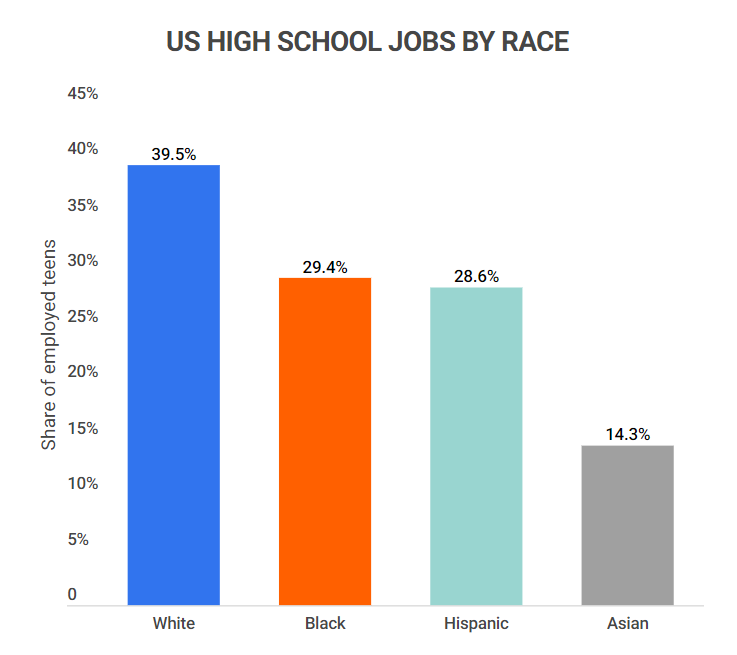
White teens are more likely to hold jobs than other racial demographics.
In the summer of 2021, about 39.5%% of white teens between the ages of 16 and 19 had jobs. 29.4% of Black teens, 28.6% of Hispanic teens, and 14.3% of Asian teens in the same age range were employed during the same time.
This trend carries throughout the rest of the year as well, with 31.4% of white teens working in December of 2020 and 28.3% of Hispanic teens, 23.2% of Black teens, and 20.2% of Asian teens holding jobs during that same month.
The median weekly salary for a teenage worker is $497.
Multiplied by 52 weeks a year, that’s $25,844 annually.
This median covers 16- to 19-year-olds who are working full time. It rises and falls throughout the year due to the seasonal nature of many jobs held by teens, but this is a good reference point for 2020 as a whole.
Types of high school jobs statistics
High school jobs tend to be similar to one another, given that teenagers lack experience. The jobs willing to hire teens must also be willing to train them, making the job pool limited.
In 2020, food preparation and serving-related occupations were the most commonly held jobs by high school workers, with 1.231 million holding positions in this category.
More specifically, 268,000 teens between the ages of 16 and 19 were employed as cooks, 262,000 as fast food and counter workers, 259 as waiters and waitresses, and 180,000 as food preparation workers. (There are other jobs held by teenagers that fall under this category as well, but these are the most common ones.)
18.7% of all food preparation and serving-related occupations in 2021 were held by teens between the ages of 16 and 19.
This rate was only beaten by 20- to 24-year-olds who held 20.6% of these positions and 25- to 34-year-olds who held 21.1% of them.
Proportional to the size of the 16- to the 19-year-old workforce, though, this is still a large percentage of these positions, as the age group held just 3.2% of all U.S. positions in any occupation in 2020.
High school-age workers held the majority of cashier positions in 2020.
This group of workers spanning 16 to 19 years of age held 682,000 out of the total 2.552 million cashier positions held in 2020. The age group with the next highest number, 20- to 24-year olds, held 633,000.
These two age demographics are the most well-represented within cashier occupations, and after that, the number per age group drops off sharply to 389,000 for 25- to 34-year-olds working in these positions.
Summer job statistics
Summer jobs are popular with teens, as high school often prevents them from working jobs during the school year. Knowing this, we’ve gathered some essential summer job statistics:
36.6% of teens had summer jobs in 2021.
This rate is up from the 28.6% who worked during the summer months of the 2008 financial crisis, but still down from the 51.7% who had summer jobs in 2000.
In 1948, 56.5% of 16- to 19-year-olds held summer jobs. This percentage went up and down some in the decades that followed but stayed relatively steady until it began steadily dropping during the 2000s.
The accommodation and food services industry provided 36.2% of teen summer jobs in 2021.
This is the most of any sector. Retail trade was the next-highest, providing 21.3% of 16- to 19-year-olds’ summer jobs.
Arts, entertainment, and recreation came in third, providing 8.1% of all teen summer jobs.
About 2.3 million 16- to 19-year-olds worked food preparation and serving-related summer jobs in 2021.
This was the most of any category. It was followed by sales-related occupations, which gave jobs to 1.4 million teens during that same summer.
Following behind sales is arts, entertainment and recreation, which employed some 516,000 teens.
High school job trends and projections
The number of teens with summer jobs has fluctuated over time. While today’s numbers are up from the COVID-19 pandemic and the 2008 recession, far fewer teens are working today than the late 20th century. To see where the future of high school jobs might be headed, here are some interesting trends and projections:
In 2000, teens made up 2.25% of the full-time workforce versus 1.21% in 2020.
The percentage of 16- to 19-year-olds in the workforce has varied over the years, but overall it’s been on a downward trend.
There are likely many reasons for this, including shorter summers and more emphasis on after-school activities, volunteer work, and internships aimed to boost students’ college applications.
Between February and April 2020, about 1.9 million teens lost their jobs due to the COVID-19 pandemic.
As a result of the widespread closure of businesses due to lockdowns and other pandemic restrictions, the number of 16- to 19-year-olds employed in July 2020 was over a million less than the number who worked in July 2019.
In addition, the 30.8% of teens who held summer jobs in 2020 was the lowest rate since the Great Recession’s 29.6% in 2008.
33.7% of teens were employed in May 2023, the highest rate for this month since 2008.
This shows that the employment rates for those between 16 and 19 years old are recovering since dipping during the COVID-19 pandemic.
However, this is still continuing the downward trend of teen employment since 2000.
High school job FAQ
What percentage of high school-age students have jobs?
Just over 30% of high school-age students have jobs. This percentage is higher for students with summer jobs, as 36.6% of 16- to 19-year-olds worked during the summer of 2021.
Is having a job in high school worth it?
Generally, yes, having a job in high school is worth it.
Of course, this depends on how well you’re able to balance your work and school responsibilities, but if you’re successful, it’ll show college admissions counselors and hiring managers that you are responsible, organized, and driven.
How many hours can teens work each week?
Teens who are at least 16 years old can work any number of hours each week. They have to follow any hourly restrictions that adult employees do, and some states might have stricter rules, but as far as federal laws are concerned, teens have no limits on hours once they turn 16.
14- and 15-year-olds, on the other hand, can’t work more than 18 hours during a school week and 40 hours during a non-school week. There are also limits on the times they can work during the day to ensure they can still attend school.
Why are fewer teens working?
Fewer teens are working because of reduced demand and higher competition. Contrary to the stereotype that modern teens are lazier or more entitled, the reality is that the jobs that would have been taken by teens in the past are less readily available to them.
For example, over 40% of those 55+ years old are actively looking for work, meaning that these older and more experienced employees often have an easier time finding work in retail and other jobs teens often apply for. Companies also see older employees as more stable, given that teens are more likely to move onto different work or go to college in the future.
These two factors combined make it very difficult for teens to compete with older applicants.
Conclusion
About one-third of teenagers between the ages of 16 and 19 hold jobs. Some work throughout the school year, but the majority work summer jobs.
These young employees often work in the food service industry and in the retail or sales industry as cashiers, servers, cooks, or stockers.
The COVID-19 pandemic greatly reduced the number of summer jobs this age demographic held during 2020, as 1.9 million of them lost their jobs between February and April of that year. Just 30.8% of teens worked that summer, the lowest rate since the Great Recession in 2008.
While these rates seem to be recovering throughout 2021, the number of 16- to 19-year-olds who hold positions has been in a steady decline over the past decade.
There are a variety of reasons for this, but some of the factors include an increased emphasis on volunteer work, internships, and other extracurricular activities in order to help students make their college applications look more attractive.
References
U.S. Bureau of Labor Statistics. “Data Retrieval: Labor Force Statistics (CPS).” Accessed on June 23, 2023.
Pew Research Center. “During the Pandemic, Teen Summer Employment Hit Its Lowest Point Since the Great Recession.” Accessed on June 23, 2023.
U.S. Bureau of Labor Statistics. “Labor Force Statistics From the Current Population Survey.” Accessed on June 23, 2023.
U.S. Department of Labor. “Fair Labor Standards Act Advisor.” Accessed on June 23, 2023.
-
Demographic Reports
Author
Chris Kolmar is a co-founder of Zippia and the editor-in-chief of the Zippia career advice blog. He has hired over 50 people in his career, been hired five times, and wants to help you land your next job. His research has been featured on the New York Times, Thrillist, VOX, The Atlantic, and a host of local news. More recently, he's been quoted on USA Today, BusinessInsider, and CNBC.