Surveillance of influenza and other seasonal respiratory viruses in winter 2021 to 2022
Updated 3 July 2023

© Crown copyright 2023
This publication is licensed under the terms of the Open Government Licence v3.0 except where otherwise stated. To view this licence, visit nationalarchives.gov.uk/doc/open-government-licence/version/3 or write to the Information Policy Team, The National Archives, Kew, London TW9 4DU, or email: [email protected].
Where we have identified any third party copyright information you will need to obtain permission from the copyright holders concerned.
This publication is available at https://www.gov.uk/government/statistics/annual-flu-reports/surveillance-of-influenza-and-other-seasonal-respiratory-viruses-in-winter-2021-to-2022
This report describes surveillance findings for seasonal influenza, other seasonal respiratory viruses and the monitoring of human cases of avian influenza and Middle East Respiratory Syndrome coronavirus (MERS-CoV).
In the 2021 to 2022 season (from week 40 of 2021 to the week 14 of 2022 reporting cut-off), low levels of influenza activity were seen across the UK, with most indicators remaining below baseline for the majority of the season. Although activity was generally higher than levels observed during the 2020 to 2021 season, it remained much lower than those in previous seasons.
Through several indicators, low level increases in activity were observed first in 2021 before coronavirus (COVID-19) Omicron control measures from late November 2021 suppressed influenza transmission. Influenza subsequently increased in multiple indicators up to week 14 of 2022 (declining thereafter, data not shown), representing late-season activity.
Influenza A(H3N2) was the predominant subtype, with low-level influenza type B Victoria lineage in 2021 and influenza A(H1N1)pdm09 detections becoming more prominent in 2022 though still a small proportion of subtyped viruses. Of the genetically characterised influenza A(H3N2) detections, the majority were in the subclade 3C.2a1b.2a.2.
Due to the COVID-19 pandemic, data reported from the various influenza surveillance systems should be interpreted with caution. Increases seen in some indicators may not accurately reflect influenza activity but rather COVID-19 activity, and that of other respiratory pathogens.
Interpretation of influenza surveillance data should take into account the effect of public health messaging and other non-pharmaceutical interventions, as well as potential changes in health seeking behaviours due to COVID-19 activity.
In primary care, GP influenza-like illness (ILI) consultation rates across the UK remained below baseline intensity levels for the duration of the 2021 to 2022 season. Rates were generally higher than those observed in the 2020 to 2021 season, however remained much lower than rates observed in seasons prior.
In secondary care, both hospital and critical care (ICU or HDU) influenza admissions remained below the baseline threshold levels for the majority of the season, with hospital admissions rising slightly above the baseline in week 12 and week 14 of 2022. While rates were higher than those observed in 2020 to 2021, admissions were lower than those seen in previous seasons.
Provisional end-of-season vaccine effectiveness (VE) was 26% (95% confidence interval (CI) 5% to 43%) against all laboratory-confirmed influenza illness in adults aged 50 years and over. For children aged 1 to 17 years, VE was 73% (95% CI 53% to 84%).
Adults aged 50 to 64 years old were again offered the flu vaccine in 2021 to 2022, after the supply-dependent extension of the programme to this cohort in 2020 to 2021. The childhood programme was also extended in secondary school children across the UK up to the school leaving age (the school year in which children turn 16 years of age).
Vaccine uptake in England varied by cohort for the 2021 to 2022 season. Vaccine uptake in those aged 65 years and over was at 82.3% compared to 80.9% in 2020 to 2021. This is the highest uptake ever achieved in this cohort, and is likely to reflect the continued awareness of the protection from vaccination since the COVID-19 pandemic.
For other cohorts, vaccine uptake was slightly below levels observed in 2020 to 2021, with uptake in 2 and 3 year olds at 50.1% compared to 56.7% in 2020 to 2021. Vaccine uptake in those aged 6 months to under 65 years clinically at-risk was similar to last season, at 52.9% compared to 53.0% in 2020 to 2021.
Vaccine uptake in pregnant women in England in the 2021 to 2022 season was 37.9%, compared to 43.6% in 2020 to 2021.
The 2021 to 2022 season saw 61.4% of all frontline HCWs with direct patient care (from all organisations submitting data) receiving the influenza vaccine in England, down from 76.8% in the 2020 to 2021 season. This is lower than the uptake observed in this cohort in the previous 5 seasons.
The influenza vaccination programme in the UK for school-aged children was extended in secondary school aged children in 2021 to 2022. Vaccine uptake in all primary school age children in England (age 4 to 11 years old) was 57.4% compared to 62.5% in 2020 to 2021. Vaccine uptake in all secondary school age children in England (age 11 to 16 years old) was 43.6%.
Activity from other circulating seasonal respiratory viruses, including respiratory syncytial virus (RSV), was generally higher than levels observed in 2020 to 2021 but lower than levels in pre-pandemic seasons. RSV activity was relatively low between week 40, 2021 and week 14, 2022 after out-of-season increases in summer 2021.
Novel and emerging respiratory viruses including MERS-CoV and avian-origin influenza viruses, have continued to result in human cases in affected countries. There have been multiple detections of avian influenza in avian species in the UK in 2021 to 2022 as reported by the Department for Environment, Food and Rural Affairs (DEFRA).
The UK reported a first human case of influenza A(H5N1) in January 2022 in a person directly exposed to infected birds, with no evidence of onward transmission.
Surveillance and public health measures are recommended in the UK for persons potentially exposed to infected birds and for severe respiratory disease among travellers returning from affected countries.
Influenza in the UK
Surveillance of influenza and other seasonal respiratory viruses in the UK is undertaken throughout the year and collated on behalf of the 4 nations of the UK by the Influenza Surveillance team at the UK Health Security Agency (UKHSA).
This is in collaboration with teams within UKHSA, Public Health Scotland (PHS), Public Health Wales (PHW) and the Public Health Agency (PHA) Northern Ireland, who are each responsible for monitoring influenza activity for their respective countries.
Surveillance is also carried out for novel respiratory viruses, including MERS-CoV which was first recognised in September 2012 and for human infections with avian influenza such as influenza A(H7N9) which emerged in China in 2013; influenza A(H5N1) which emerged in China in 2003 and influenza A(H5N6) which has been seen in China since 2013.
Weekly outputs on influenza are normally published during the winter season between October (week 40) and May (week 20), the period when influenza typically circulates. From the 2020 to 2021 season, reports containing surveillance data on both influenza and COVID-19 have continued to be published on a weekly basis.
A variety of data sources are collated to provide information on influenza activity and to provide rapid estimates of influenza-related burden within the community, on the health service and in excess all-cause mortality. In addition, in-season and end-of-season monitoring of seasonal influenza vaccine uptake and vaccine effectiveness is undertaken.
This report describes influenza activity observed in the UK in the period from week 40, 2021 (week ending 10 October 2021) to week 14, 2022 (week ending 10 April 2022). This includes observations and commentary on influenza activity, activity of other seasonal and novel respiratory viruses and from the influenza vaccination programmes.
It is important to note that flu activity continued beyond week 14 of 2022, representing late-season activity. Surveillance of influenza and other respiratory viruses continues to be carried out, with further data published in the UKHSA weekly national influenza and COVID-19 surveillance report.
The moving epidemic method (MEM)(1) is used by the European Centre for Disease Prevention and Control (ECDC) to standardise reporting of influenza activity across Europe. It has been adopted by the UK and is presented for GP influenza-like illness (ILI) consultation rates for each UK scheme and for the hospitalisation and intensive care unit (ICU) admissions rate through the SARI Watch scheme.
The current MEM thresholds have been applied to data since the 2019 to 2020 season in England, Wales and Northern Ireland.
During the 2021 to 2022 season, the licensed live attenuated influenza vaccine (LAIV) was offered to children aged 2 to 16 years. In England, LAIV was offered to 2 and 3 year olds through primary care and to all children in primary and secondary school (all children from reception to year 11, aged 4 to 16 years old) through schools this year.
This is the first influenza season where all children up to the school leaving age in the UK have been offered vaccination through the schools’ programme. During the 2021 to 2022 season, influenza vaccination was again offered to individuals between 50 and 64 years old.
Measures put in place to control the COVID-19 pandemic have affected the transmission of influenza and other respiratory viruses. These measures included public health messaging, social and physical distancing measures, national lockdowns, the wearing of face coverings, hand hygiene and travel restrictions. Changes in healthcare-seeking behaviour also affect some influenza indicators.
Although many of these restrictions and interventions were lifted by the 2021 to 2022 influenza season, these factors continue to be important to consider when interpreting the influenza surveillance indicators presented in this report. In particular, additional measures were introduced in late November 2021 to control the emerging Omicron variant of SARS-CoV-2 and were eased incrementally from the second half of January 2022.
Community surveillance
Syndromic surveillance
In England, national UKHSA real-time syndromic surveillance systems include GP in-hours (GPIH) consultations and GP out-of-hours (GPOOH) contacts, emergency department (ED) attendances (Emergency Department Syndromic Surveillance System (EDSSS)) and NHS 111 calls and online assessments.
These systems monitor a range of indicators sensitive to community influenza activity, for example NHS 111 ‘cold or flu’ calls and GP in-hours consultations for ILI.
COVID-19 activity caused an increase in the use of ILI codes and other similar codes in the late stages of the 2019 to 2020 season in England. COVID-19 specific clinical codes were released during 2021 and were thereby available for use from the 2020 to 2021 season onwards.
ILI (and similar respiratory) codes will not have been used to record COVID-19-like attendances, and many consultations that would, in previous seasons, have been coded to ILI are likely to have been assigned to COVID-19 codes from this point onwards. This should be noted when comparing to the rates between seasons.
Furthermore, healthcare-seeking behaviour has also been affected during the COVID-19 pandemic due to periods of national lockdown and changes in guidance on how the public should access healthcare services. Syndromic data over the last two winter seasons should therefore be interpreted with some caution.
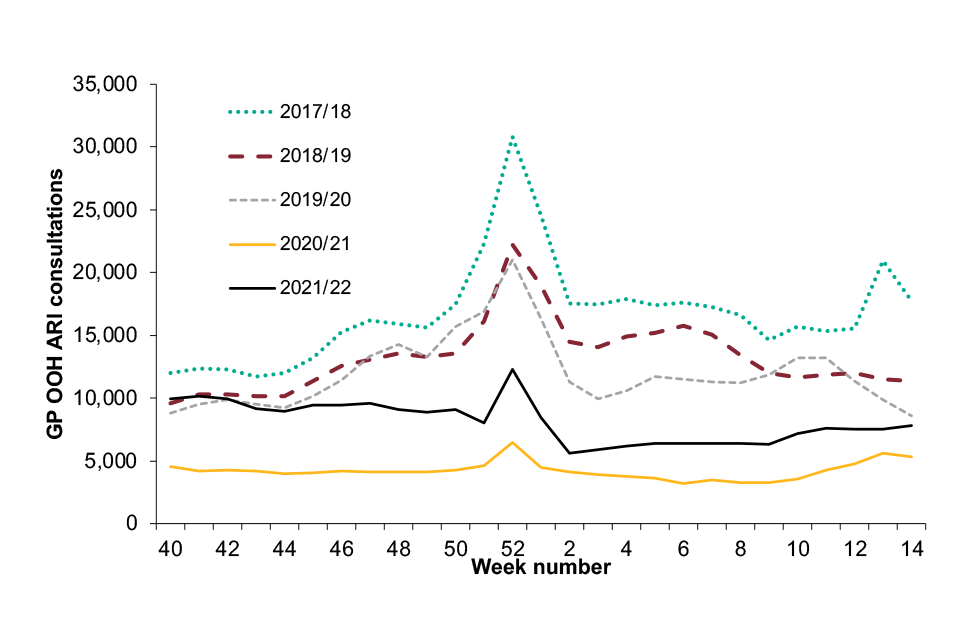
During winter 2021 to 2022, syndromic surveillance indicators for GPIH ILI consultation rates remained low throughout the season and much lower than seen in previous seasons. Similarly, GPIH pneumonia consultation rates remained at low levels throughout the season, at similar levels to those observed in 2020 to 2021 but lower than those seen in previous seasons (Figure 1).
GPIH ILI consultation rates remained stable and lower than those observed in previous seasons. GPOOH contacts remained stable and generally lower than those observed in seasons prior to the COVID-19 pandemic. GPOOH acute respiratory infection (ARI) contacts remained lower than that seen in pre-pandemic seasons, but higher than those observed in 2020 to 2021 (Figure 1d).
Figure 1a. Weekly all age GP in-hours consultations for ILI
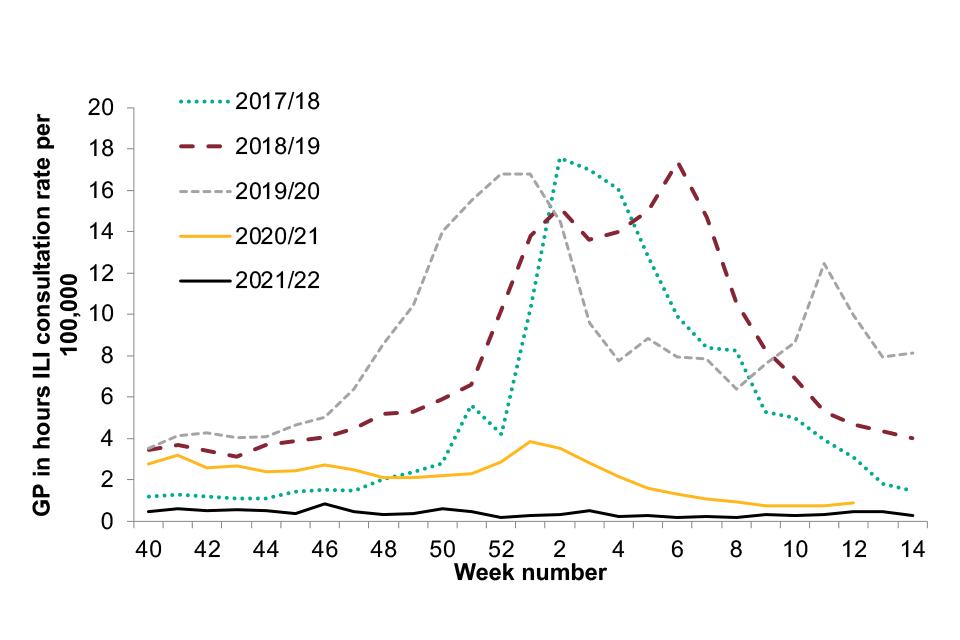
Figure 1b. Weekly all age GP in-hours consultations for pneumonia
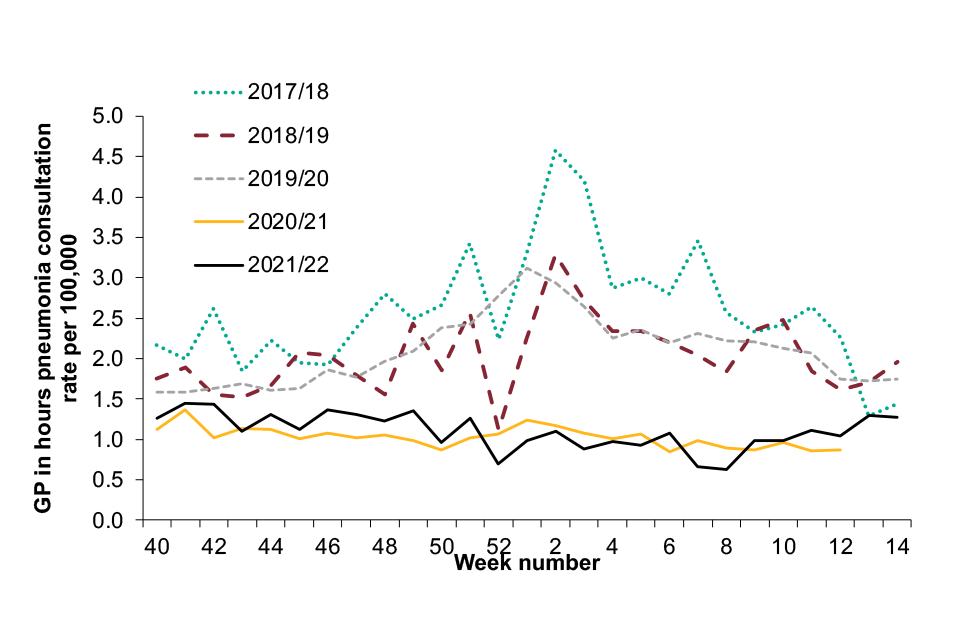
Figure 1c. GPOOH contacts for ILI
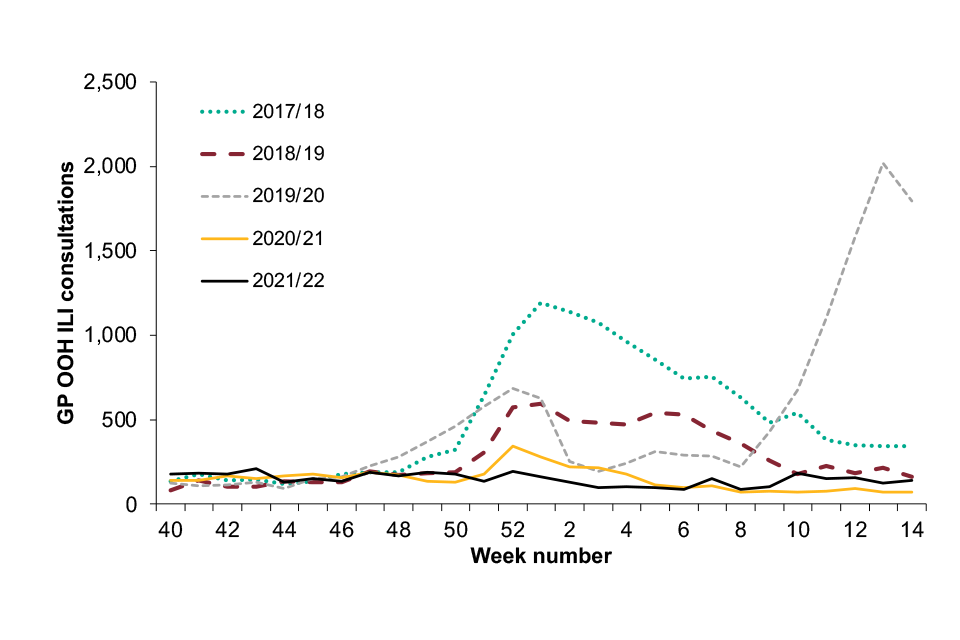
Figure 1d. Weekly all age GPOOH contacts for ARI for winter 2017 to 2021, England
ED attendance data presented here represents 94 EDs that reported throughout the most recent 4 influenza seasons. Therefore, numbers may differ slightly from those presented in the 2020 to 2021 annual report where a different number of EDs were included.
ARI ED attendances were higher at the beginning of the season than in the previous 3 seasons, with a particular decline observed in late 2021 likely to be in line with the introduction of non-pharmaceutical interventions during the SARS-CoV-2 Omicron wave (Figure 2).
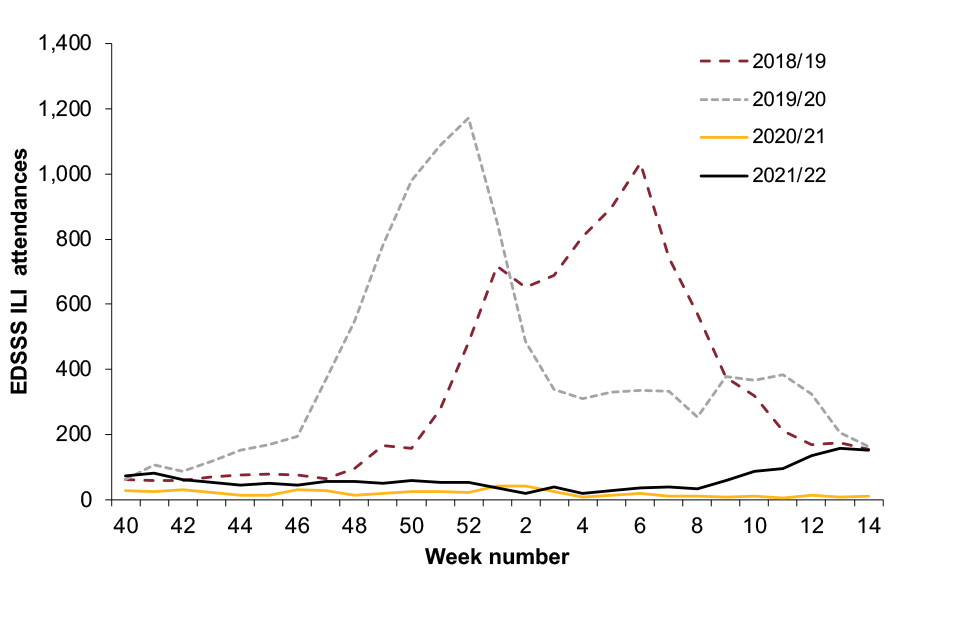
Pneumonia ED attendances followed a similar pattern, with attendances largely below those seen during pre-pandemic seasons (Figure 2). ILI ED attendances remained low throughout the season until week 8, when increases were observed (Figure 2).
Figure 2a. Weekly all age Emergency Department Syndromic Surveillance System (EDSSS) acute respiratory infection (ARI) attendances
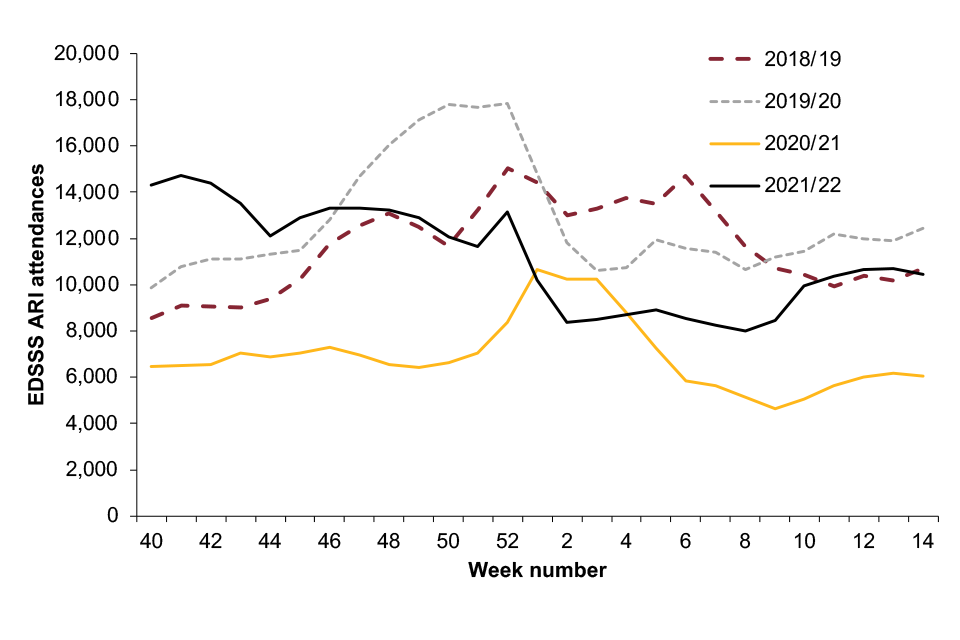
Figure 2b. Weekly all age EDSSS pneumonia attendances for winter 2018 to 2021
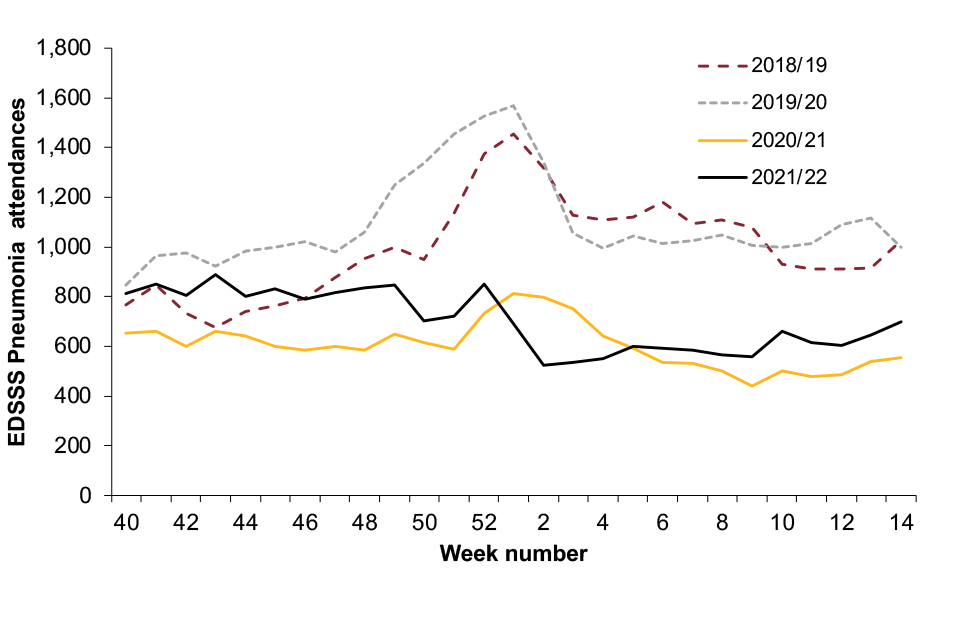
Figure 2c. EDSSS ILI attendances for winter 2018 to 2021
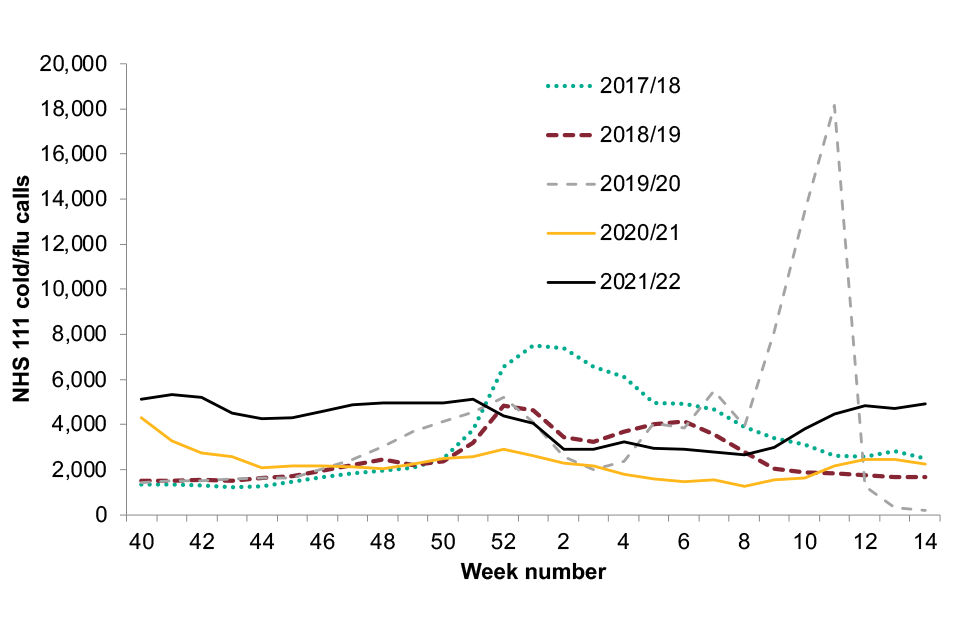
The number of NHS 111 ‘cold or flu’ calls was generally higher than the numbers seen in the previous 4 seasons up to week 51 of 2021. Numbers declined and remained stable until week 8 2022 where increases were observed, in line with increasing influenza activity (Figure 3).
Figure 3. Weekly all age England NHS 111 cold or flu calls for winter 2017 to 2021
In Wales, the weekly proportion of cold or flu calls made to NHS Direct Wales remained relatively low and stable throughout the season (Figure 4).
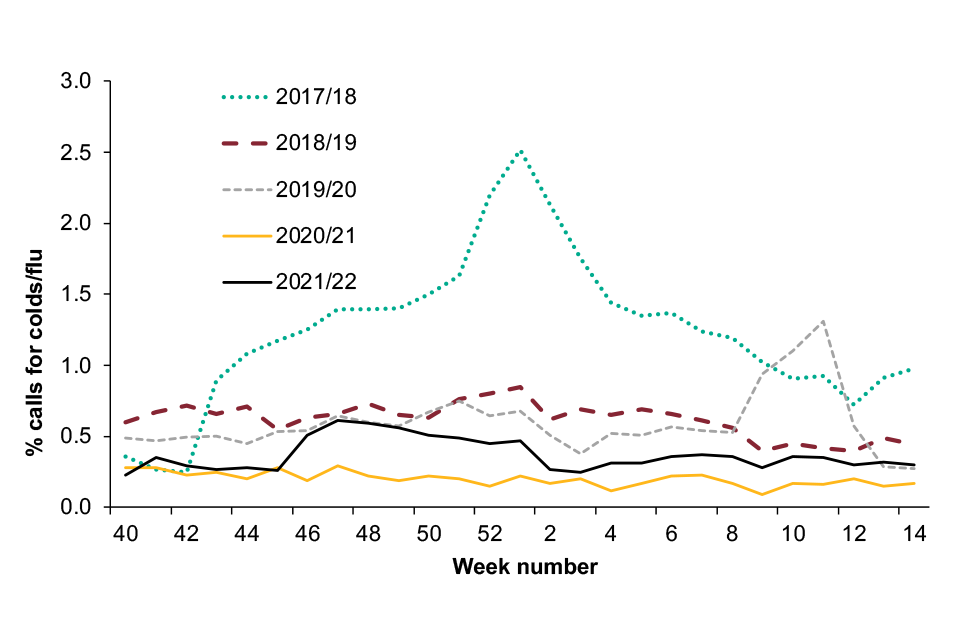
In Scotland, the weekly proportion of all calls to NHS 24 which mention cold or flu, was slightly higher than those observed in 2020 to 2021 however remained low throughout the season and much lower than those seen in the 3 previous seasons (Figure 5).
Figure 4. Proportion of calls for cold or flu (all ages) to NHS-Direct, Wales, 2017 to 2022
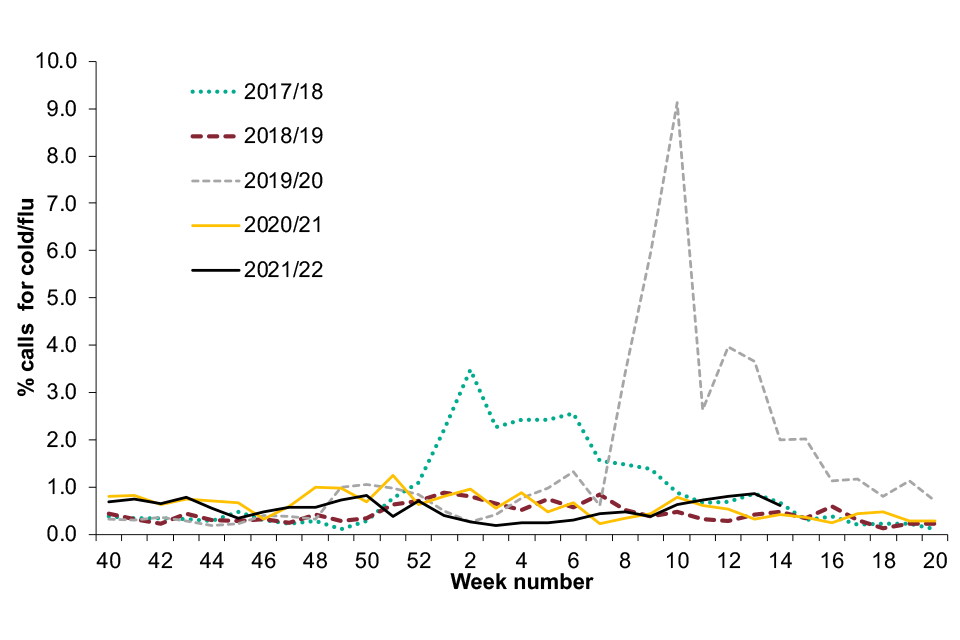
Figure 5. Proportion of calls for cold or flu (all ages) through NHS 24, Scotland, 2017 to 2022
FluSurvey (internet based surveillance)
Flusurvey, run by UKHSA, provides internet-based surveillance of ILI and COVID-19 symptoms in the UK population. It is part of a European wide initiative (including 11 European countries).
On registration, individuals aged 18 and over complete a baseline profile questionnaire which collects information on demographic, geographic, socioeconomic (household size and composition, occupation, education, and transportation), and health (vaccination, diet, pregnancy, smoking, and underlying medical conditions) data.
Subsequently, participants are sent weekly reminders via email to report any symptoms relating to flu or COVID-19 that they may have experienced and their health-seeking behaviour as a result of their symptoms. This creates a fast, reliable and flexible real-time monitoring surveillance system.
Recruitment of survey participants remained open throughout the 2021 to 2022 season as a result of the ongoing pandemic.
A total of 2,887 participants were recruited and completed at least one survey. The average weekly particilation was 2,625 (90.9%), contributing 70,782 responses across the 2021 to 2022 season.
There were more participants in the 46 to 64 year age group (42.9%) compared to other age groups (0 to 18 years (2.3%), 19 to 45 years (15.3%), 65 years and over (39.5%)). There was a higher proportion of female participants compared to male participants (66.0% vs 34.0%). The majority (2,581 or 89.7%) of participants were resident in England, 177 participants were from Scotland, 19 participants were from Northern Ireland and 92 from Wales.
Any participant completing the symptoms questionnaire during the reporting week was included in the analysis. The ECDC ILI case definition of sudden onset of symptoms and at least one of: fever, malaise, headache or muscle pain and at least one of: cough, sore throat, shortness of breath was applied. The total number of self-reported ILI episodes was 1,505 (2.1%).
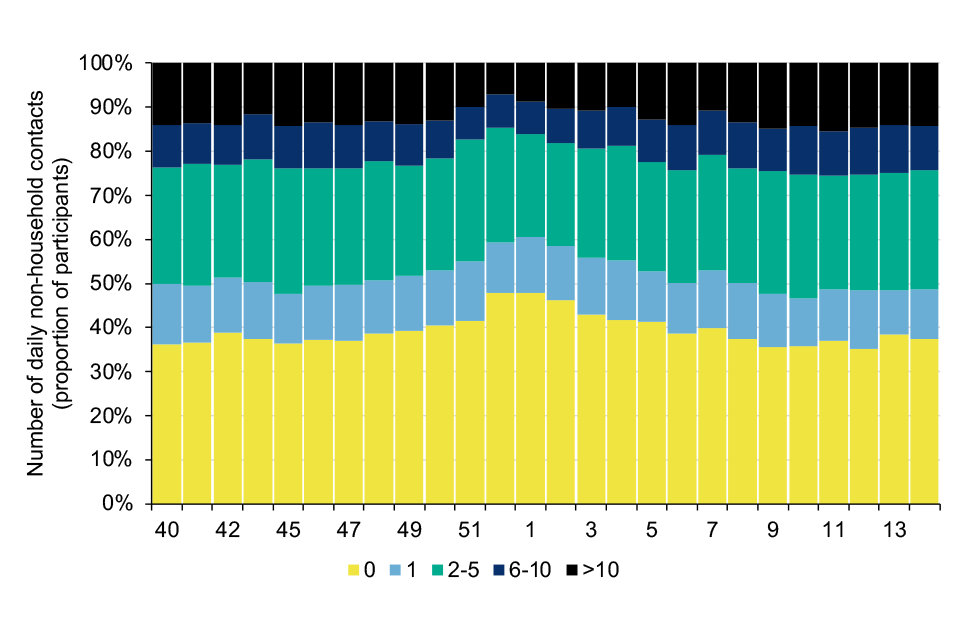
Overall, self-reported ILI activity was higher than that observed in the previous season, with peaks in weeks 44, 1 and 13 (Figure 6). Social mixing patterns amongst participants showed variation in how participants were mixing and meeting contacts outside of their households during the survey period.
Mixing activity reduced through December, coinciding with Omicron controls, with increases observable from mid-January.
Further analysis of the 2021 to 2022 flu survey will be available on the FluSurvey website in the summer.
Figure 6. Weekly ILI incidence per 1,000 by reported through FluSurvey
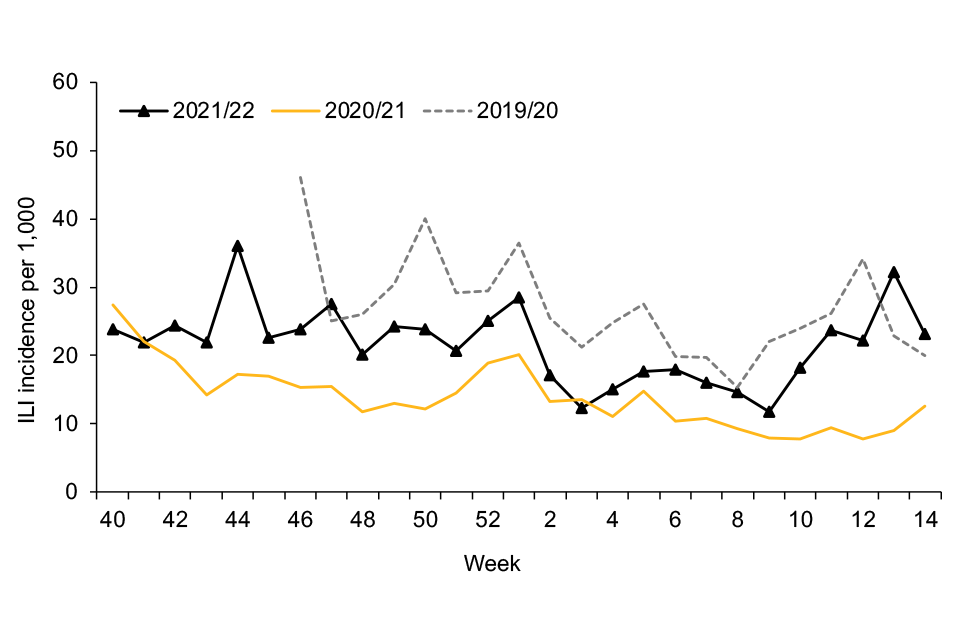
Please note that in the 2019 to 2020 season, FluSurvey reporting began in week 46.
Figure 7. FluSurvey participants’ self-reported number of social contacts outside the household
FluDetector (internet based surveillance)
UKHSA works with University College London (UCL) to assess the use of internet-based search queries as a surveillance method for ILI in England. This is part of work on early-warning surveillance systems for influenza, through the Engineering and Physical Sciences Research Council (EPSRC) Interdisciplinary Research Collaboration (IRC) project i-sense.
Combining natural language processing and machine learning techniques, a non-linear Gaussian process model was developed by UCL (2) to produce real-time estimates of ILI.
The supervised model, trained on historical data from the Royal College of General Practitioners (RCGP) scheme (2005 to 2006 to 2016 to 2017 seasons at national level), produces daily ILI estimates based on the proportion of ILI related search queries within a 10% to 15% sample of all queries issued, and is extracted daily from Google’s Health Trends Application Programming Interface.
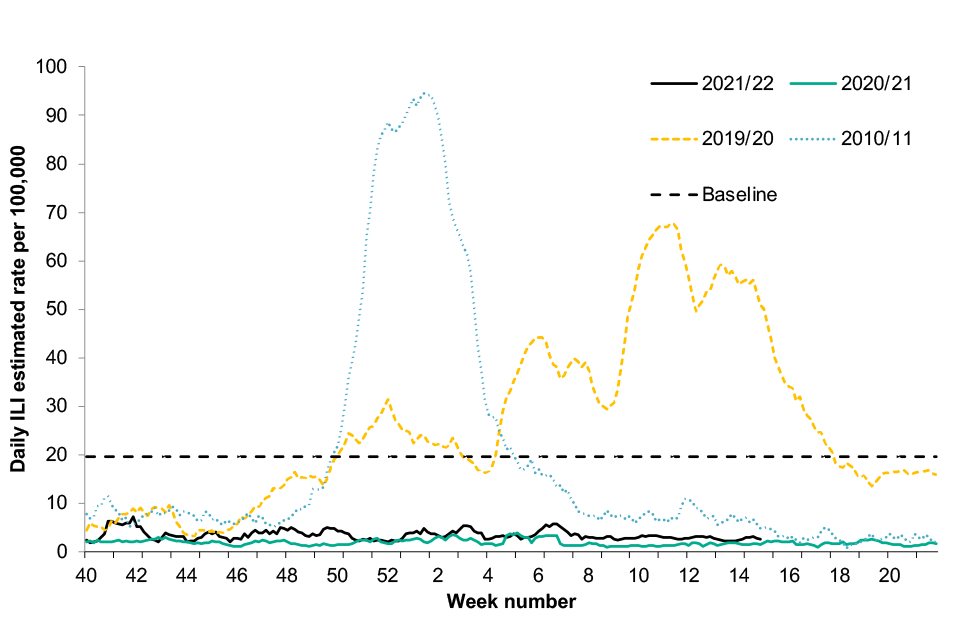
Estimated rates of ILI remained very low throughout the 2021 to 2022 season and below the baseline threshold level of 19.6 per 100,000. Overall estimated rates were slightly higher than those seen in 2020 to 2021, but lower than prior seasons (Figure 8).
Figure 8. Daily estimated ILI Google search query rates per 100,000 population
Outbreak reporting
Incidents are suspected outbreaks of acute respiratory infections linked to a particular setting. Between week 40 2021 and week 14 2022, a total of 29,625 incidents in closed settings were reported in the UK, the majority of which were SARS-CoV-2.
The 2021 to 2022 season saw an increase in the number of incidents of influenza and other respiratory viruses compared to the 2020 to 2021 season, however levels remained low compared to pre-pandemic seasons.
England
In England, there were a total of 22,536 confirmed ARI incidents in closed settings reported between week 40 of 2021 and week 14 of 2022. Of these, 13,139 (58.3%) were reported from care homes, 3,772 (16.7%) from educational settings, 1,139 (5.1%) from hospital settings and 4,486 (19.9%) from other settings.
Where information on virological testing results were available, 15,434 were confirmed as SARS-CoV-2, followed by 30 influenza A incidents, 24 rhinovirus incidents, 13 RSV and 6 other viruses (Table 1).
Table 1. The number of incidents in England by institution and virus type between week 40 2021 and week 14 2022
| Setting | Influenza | SARS-CoV-2 | Other respiratory viruses | No organism reported |
|---|---|---|---|---|
| Care home | 21 | 9,770 | 38 | 3,310 |
| Hospital | 6 | 613 | 3 | 517 |
| Educational settings | 3 | 2,010 | 1 | 1,758 |
| Prison | 0 | 122 | 0 | 31 |
| Workplace settings | 0 | 520 | 0 | 127 |
| Food outlet or restaurant | 0 | 8 | 0 | 6 |
| Other | 0 | 2,391 | 1 | 1,280 |
| Total | 30 | 15,434 | 43 | 7,029 |
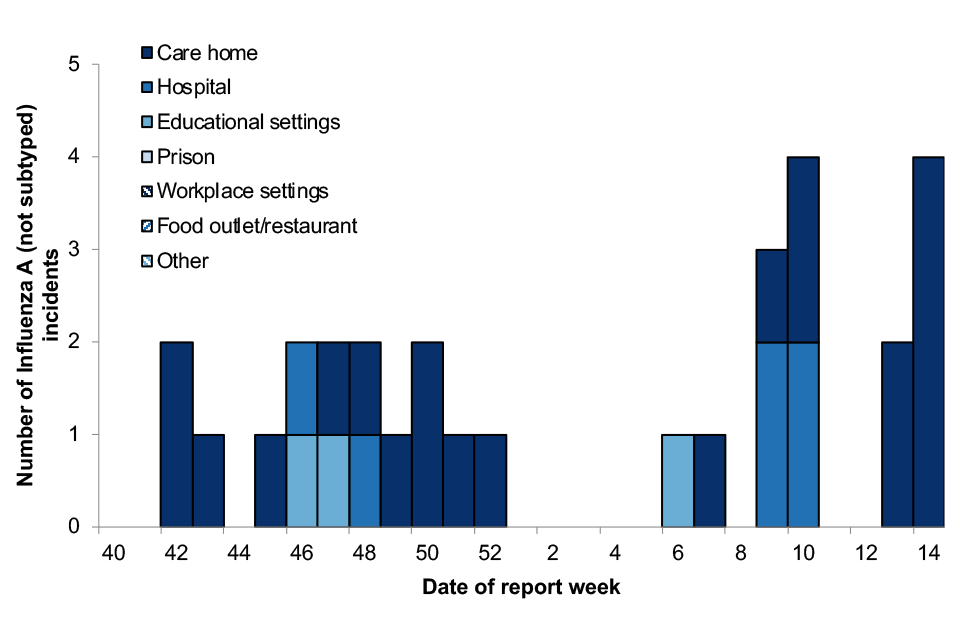
There were a total of 30 influenza incidents reported in this period, all of which were confirmed as influenza A (not subtyped). The majority of these occurred in care home settings, with the highest number in a week observed during week 14 (Figure 9).
Figure 9. The number of influenza A outbreaks by week and setting, 2021 to 2022
Scotland
In Scotland, there were a total of 4,806 ARI outbreaks reported between week 40 2021 and week 14 2022. An outbreak is defined as at least 2 cases (laboratory confirmed and or suspected) of any acute respiratory illness within 48 hours in any setting.
Of these, 1,911 (39.8%) were reported from care homes, 1,411 (29.4%) from educational settings and 1,484 from other settings (30.8%). Virological results indicate 4,591 outbreaks were SARS-CoV-2, 6 influenza (not subtyped), 4 influenza A, 3 RSV and one each of enterovirus and rhinovirus.
Outbreaks captured through the Outbreak Management tool (OBM) and HPZone are reported, therefore the total number of outbreaks may be an underestimate. Non-SARS-CoV-2 outbreaks are only reported through HPZone.
De-duplication processes are applied to outbreaks in both OBM and HPZone, however there is potential for double counting. Please note that the denominator for different settings will vary significantly, as does the propensity to report outbreaks between different settings. For these reasons, comparisons between settings are not advised.
Wales
In Wales, there were 1,225 outbreaks of acute respiratory infection reported to the Public Health Wales Health Protection teams between week 40, 2021 and week 14, 2022, compared to 2,869 between week 40 and week 14 during the 2020 to 2021 season.
The majority were reported from care homes (87.7%), followed by community and other setting (9.6%), hospitals (2.0%) and school and nursery settings (0.7%). Virological results were available for 1,220 confirmed respiratory outbreaks, of which one was influenza A(not subtyped) and 1,219 were SARS-CoV-2.
Northern Ireland
In Northern Ireland, there were a total of 1,058 confirmed ARI outbreaks reported to the Public Health Agency between week 40, 2021 and week 14, 2022, compared to a total of 1,025 confirmed ARI outbreaks in the 2020 to 2021 season and 201 confirmed ARI outbreaks in the 2019 to 2020 season.
Of these, 607 (57.4%) were reported from care homes, 310 (29.3%) from hospitals and 141 (13.3%) from other settings. Virological results were available for 1,058 confirmed respiratory outbreaks of which 1,049 were SARS-CoV-2, 4 were influenza A(not subtyped), 3 influenza (not subtyped) and 2 human parainfluenza viruses.
Further information on ARI incidents during the 2021 to 2022 season is available in the weekly influenza and COVID-19 surveillance report and information on ARI incidents occurring in previous seasons is available in previous annual flu reports.
Primary care consultations
England
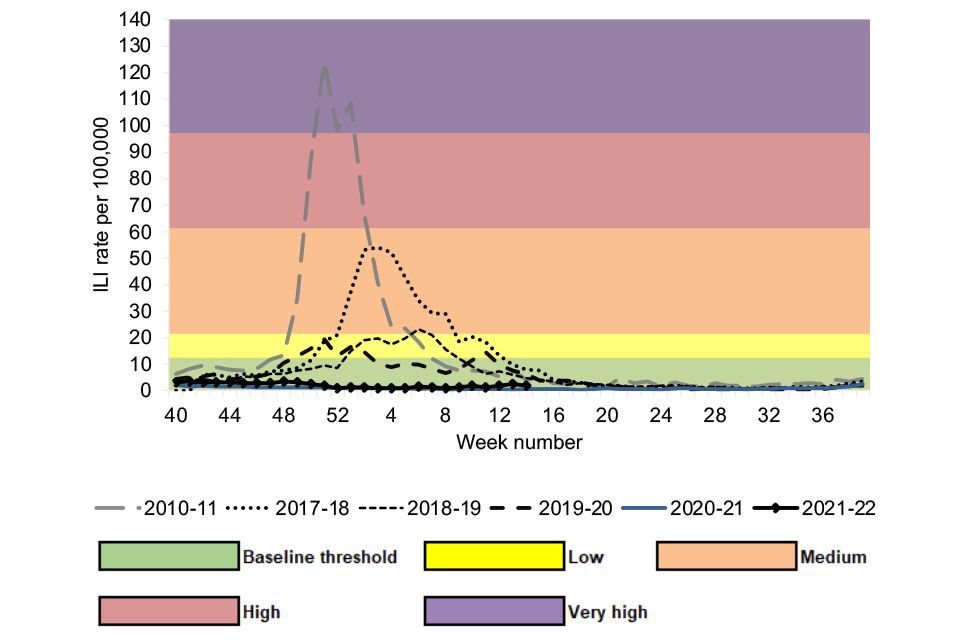
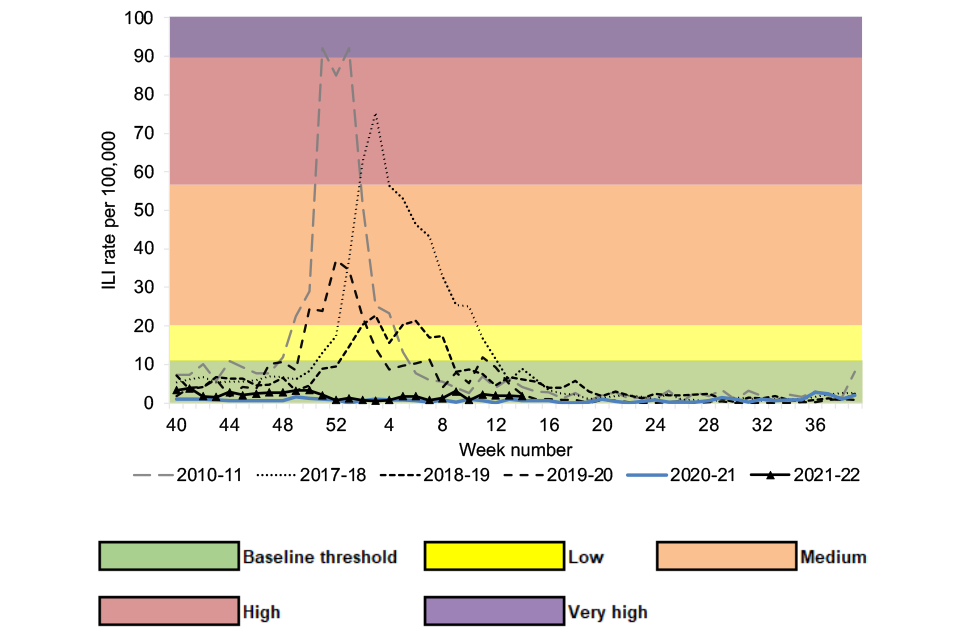
Weekly rates of GP consultations for influenza-like illness (ILI) through the RCGP scheme remained below the 2021 to 2022 season MEM baseline threshold of 12.2 per 100,000 for the duration of the influenza season (Figure 10).
The ILI rate for 2021 to 2022 remained low and below baseline threshold up to week 14. The ILI rate was higher than that observed in the 2020 to 2021 season, however remained much lower than rates observed in seasons prior. In 2019 to 2020, 2018 to 2019 and 2017 to 2018 the ILI rates were above the MEM baseline threshold levels for 6, 8 and 14 weeks respectively (Figure 10).
Figure 10. Weekly all age GP influenza-like illness rates for 2021 to 2022 and past seasons, England (RCGP)
Scotland
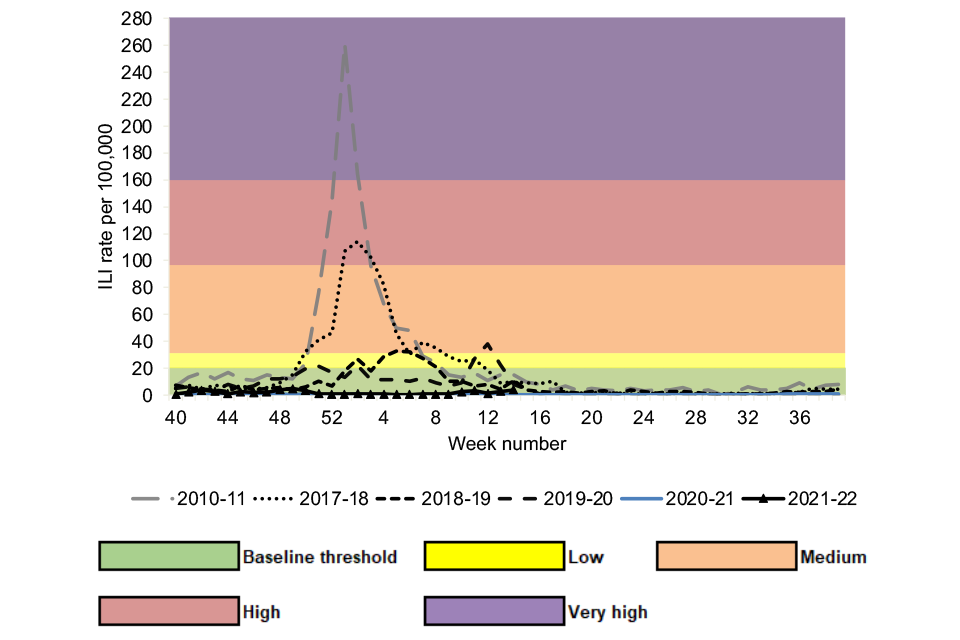
Weekly GP consultations for ILI remained below the baseline MEM threshold of 19.8 per 100,000 throughout the season in Scotland. Overall seasonal ILI activity was higher than levels observed in 2020 to 2021 however remained at much lower intensity compared to previous seasons (Figure 11).
Figure 11. Weekly all age GP influenza-like illness rates for 2021 to 2022 and past seasons, Scotland
Wales
Weekly GP consultations for ILI in Wales remained below the baseline MEM threshold of 10.97 per 100,000 for the duration of the 2021 to 2022 season. Overall seasonal ILI activity was higher than levels observed in 2020 to 2021 however remained at much lower intensity compared to previous seasons (Figure 12).
Figure 12. Weekly all age GP influenza-like illness rates for 2021 to 2022 and past seasons, Wales
Northern Ireland
Weekly GP consultations for ILI in Northern Ireland remained below the baseline MEM threshold of 11.3 per 100,000 for the duration of the season.
Rates remained similar to those observed in 2020 to 2021 and at much lower intensity than seen in previous seasons (Figure 13).
Figure 13. Weekly all age GP influenza-like illness rates for 2021 to 2022 and past seasons, Northern Ireland
Secondary care surveillance
The Severe Acute Respiratory Infection (SARI) Watch surveillance system was established in 2020 to report the number of laboratory confirmed influenza, COVID-19 and RSV cases admitted to hospital and critical care units (ICU or HDU) in NHS acute trusts across England.
This has replaced the UK Severe Influenza Surveillance System (USISS) mandatory and sentinel data collections for influenza surveillance used in previous seasons, and the COVID-19 hospitalisations in England surveillance system (CHESS) collections for COVID-19 surveillance.
The weekly rate of new admissions of influenza cases is based on the catchment population of those NHS Trusts who made a return in that week.
The MEM method has been applied to the SARI Watch hospital and ICU or HDU admissions for confirmed influenza to assess the effect of influenza activity throughout the season.
The MEM thresholds are calculated based on the 2014 to 2015 to the 2018 to 2019 seasons (data from 2019 to 2020 and 2020 to 2021 were excluded due to the COVID-19 pandemic). These thresholds have been applied to data from the 2019 to 2020 season onwards.
Hospitalisations
Through SARI Watch, a total of 1,015 hospitalised confirmed influenza cases were reported from 41 participating sentinel NHS acute trusts across England from week 40 2021 to week 14 2022.
This compares to a season total of 40 cases from 56 participating Trusts in 2020 to 2021, 4,916 cases from 22 participating trusts in 2019 to 2020, 5,675 cases from 24 participating trusts in 2018 to 2019, and 10,221 cases from 25 participating trusts in 2017 to 2018 (Figure 14).
The cumulative admission rate between week 40 and week 14 was 5.84 per 100,000 trust catchment population in 2021 to 2022. This compares to a cumulative admission rate between week 40 and week 14 of 0.18 per 100,000 in 2020 to 2021, 44.03 per 100,000 in 2019 to 2020, 45.33 per 100,000 in 2018 to 2019 and 76.20 per 100,000 in 2017 to 2018.
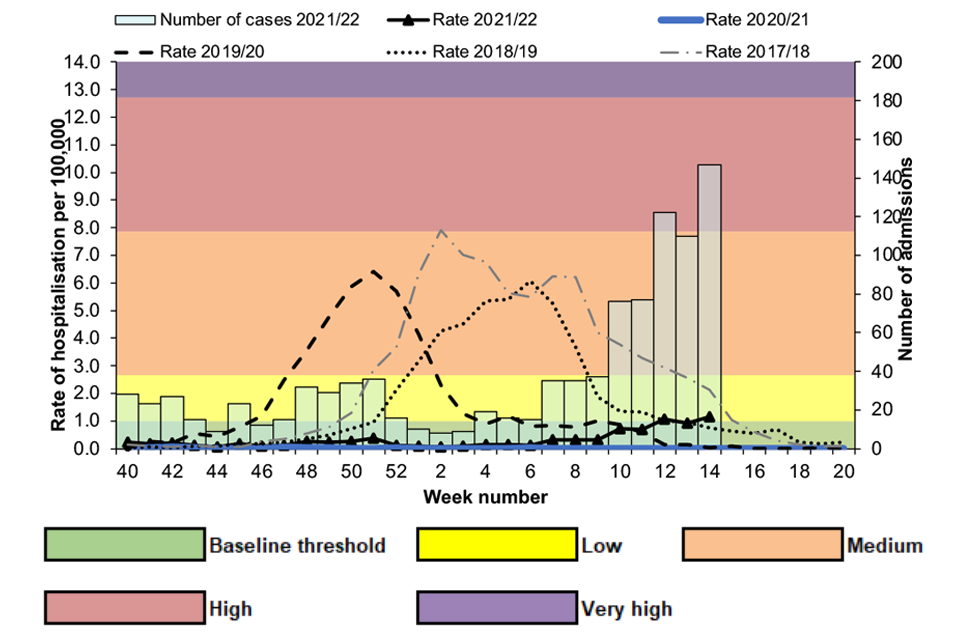
Hospital admission rates for confirmed influenza remained below the baseline threshold level (0.99 per 100,000 trust catchment population) for the majority of the 2021 to 2022 influenza season, rising slightly above the baseline in weeks 12 and 14 of 2022 (to 1.05 per 100,000 and 1.15 per 100,000 respectively).
This represents a late-season rise in influenza hospitalisation activity. While rates were generally higher this season than during the 2020 to 2021 season, rates have remained considerably lower than those observed in seasons prior to the COVID-19 pandemic (Figure 14).
Of the 1,015 influenza hospital admissions reported up to week 14 2022, 46 were influenza A(H1N1)pdm09, 269 were influenza A(H3N2), 635 were influenza A(not subtyped) and 65 were influenza B (Figure 15).
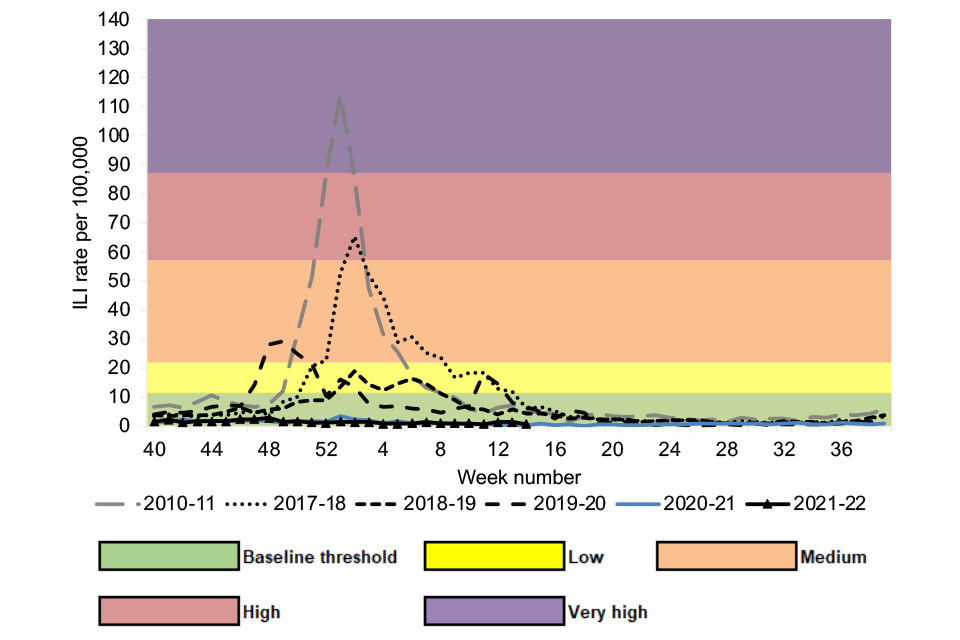
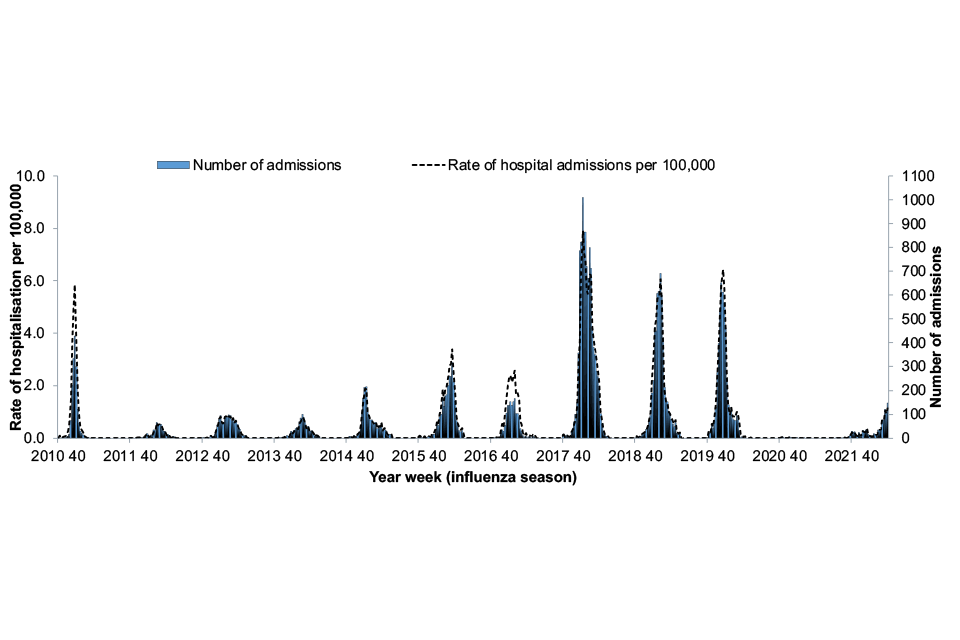
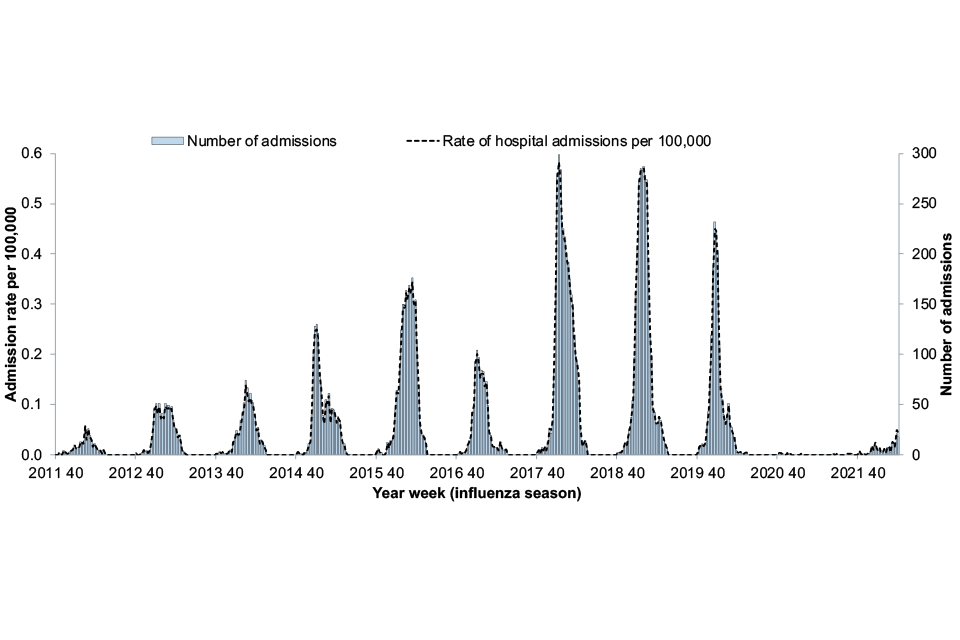
Weekly confirmed influenza hospitalisation rates to sentinel hospital trusts in England since winter 2010 are shown in figure 16.
Figure 14. Weekly overall influenza hospital admission rates per 100,000 trust catchment population (with thresholds) and number of influenza hospital admissions to sentinel Trusts, SARI Watch, England
It should be noted that in some surveillance systems the high proportion of influenza A that is unsubytped may reflect increase in the use of rapid nucleic acid amplification tests used at the point of care.
Hospital trusts are encouraged to perform influenza subtyping locally where possible or regionally and to integrate results into local information information systems.
The subtyping data is used for public health surveillance and allows a more complete picture of circulating subtypes affecting severe cases in particular.
Figure 15. Cumulative number of influenza hospital admissions by influenza type, SARI Watch, England, week 40 2021 to week 14 2022
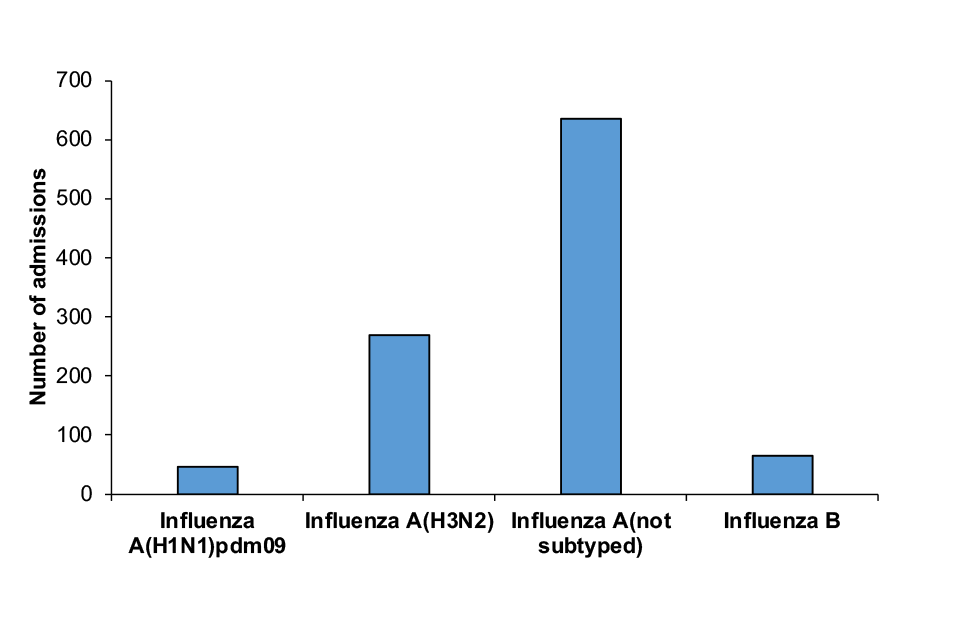
Figure 16. Weekly all-age rate and number of confirmed influenza hospital admissions to sentinel Trusts, 2010 to 2022, England
ICU or HDU admissions
Through SARI Watch, a total of 142 critical care (ICU or HDU) confirmed influenza admissions were reported from 115 NHS acute trusts across England from week 40 2021 to week 14 2022. This compares to a season total of 9 cases in 2020 to 2021, 1,671 cases in 2019 to 2020, 3,017 cases in 2018 to 2019 and 3,245 cases in 2017 to 2018 (Figure 17).
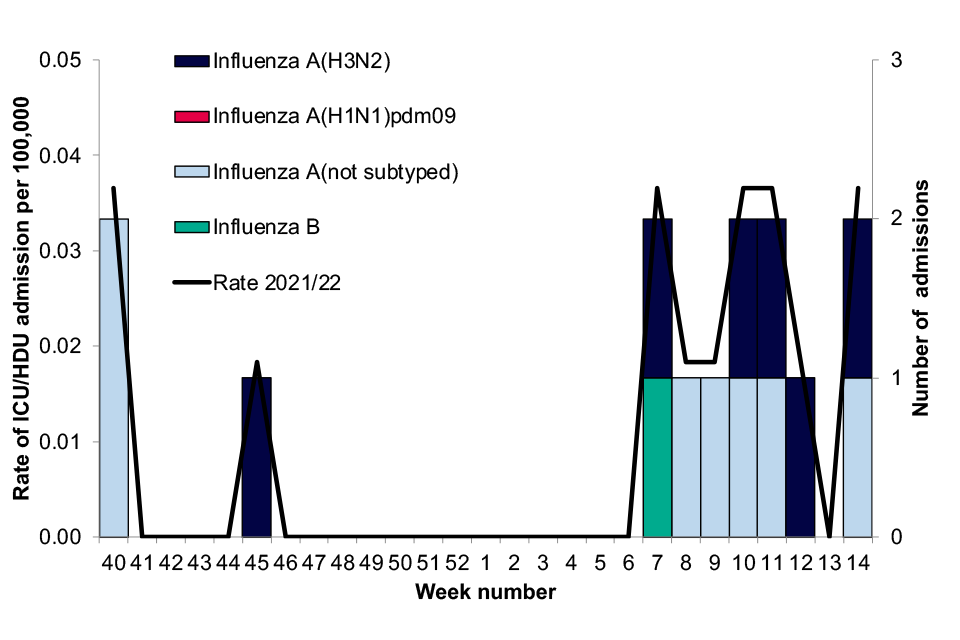
ICU or HDU admission rates for confirmed influenza remained below the baseline threshold level (0.11 per 100,000 trust catchment population) for the duration of the influenza season up to week 14 of 2022, peaking in week 13 at 0.05 admissions per 100,000 (Figure 17).
While rates were higher this season than during the 2020 to 2021 season, rates have remained considerably lower than those observed in seasons prior to the COVID-19 pandemic.
Of the 142 influenza ICU or HDU admissions reported up to week 14 2022, 11 were influenza A(H1N1)pdm09, 14 were influenza A(H3N2), 101 were influenza A(not subtyped) and 16 were influenza B (Figure 18).
Weekly confirmed influenza ICU or HDU admission rates in England since winter 2011 are shown in figure 19).
Figure 17. Weekly influenza ICU or HDU admission rates per 100,000 trust catchment population (with thresholds) and number of influenza ICU or HDU admissions, SARI Watch, England
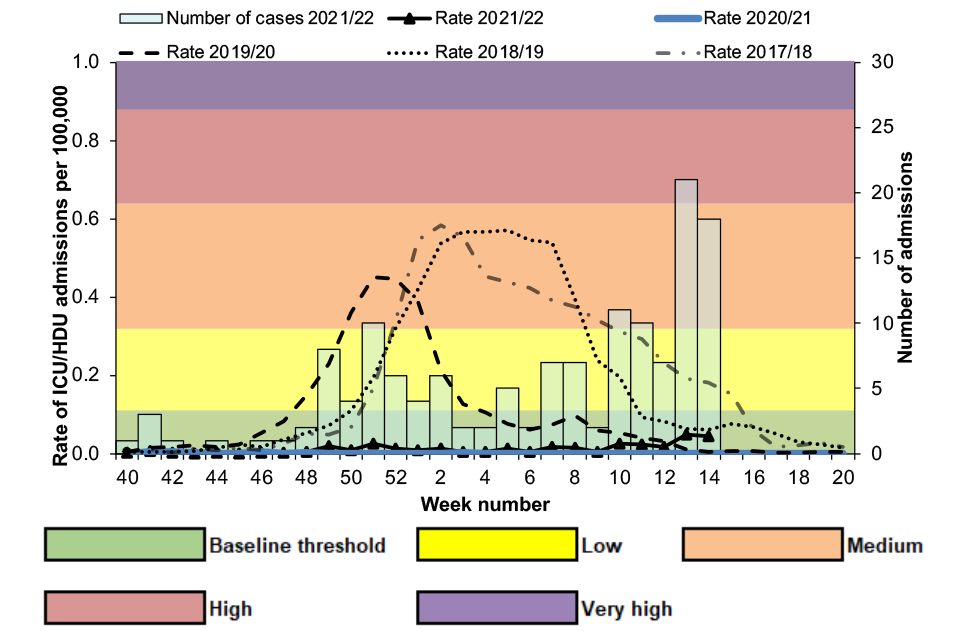
Figure 18. Cumulative number of influenza ICU or HDU admissions by influenza type, SARI Watch, England, week 40 2021 to week 14 2022
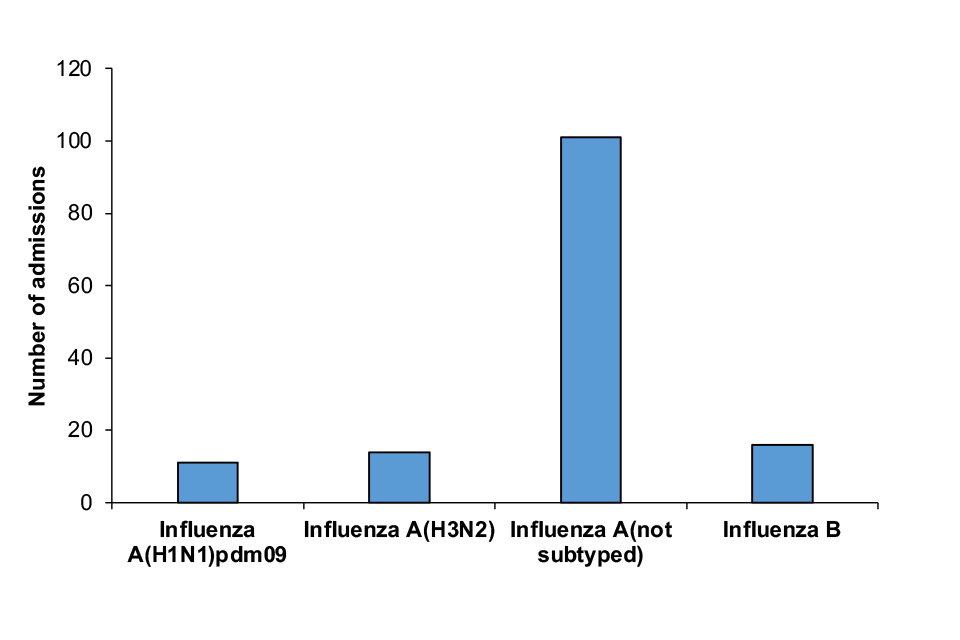
Figure 19. Weekly all-age rate and number of confirmed influenza ICU or HDU admissions, 2011 to 2022, England
Scotland
There were 14 confirmed influenza admissions to ICU or HDU in Scotland between week 40 2021 and week 14 2022. Among these there were 6 influenza A(H3N2), 7 influenza A(not subtyped) and 1 influenza B (Figure 20).
Patients admitted to ICU or HDU with recently confirmed influenza are identified from the Scottish Intensive Care Society Audit Group that collects detailed patient level data on all patients in ICU or HDU across Scotland.
Additional information on patients with laboratory confirmed influenza is collected through ICU enhanced surveillance forms. All patients that are admitted to ICU or HDU with a positive influenza test result within a period of 14 days before the ICU or HDU admission and the ICU or HDU discharge date are included.
Where the discharge date is missing, any patient with a positive influenza test result within a period of 14 days before ICU or HDU admission and 7 days after ICU or HDU admission are included.
Figure 20. Weekly number of laboratory confirmed influenza ICU or HDU cases with crude rate of admissions, Scotland
Wales
Between week 40 2021 and week 14 2022 there were 4 influenza admissions to ICU or HDU in Wales, with 1 case in weeks 44, 10, 12 and 13. Of these, 3 were influenza A(not subtyped) and 1 was an influenza A(H3N2).
Northern Ireland
Between week 40 2021 and week 48 2021 there were no new admissions to ICU or HDU in Northern Ireland with confirmed influenza. Critical care data for week 49 2021 to week 14 2022 is not available.
ECMO admissions
The UKHSA collects data on every patient admitted to a severe respiratory failure (SRF) centre, for extra corporeal membrane oxygenation (ECMO) or other advanced respiratory support, whether or not the primary cause is known to be infection-related.
There are 6 SRF centres in the UK (5 in England and 1 in Scotland) participating in the UKHSA ECMO surveillance module.
Between week 40 2021 and week 14 2022 there were no laboratory confirmed influenza admissions to SRF centres in the UK. Influenza admissions to ECMO were last detected in the 2019 to 2020 season.
Microbiological surveillance
Influenza
The Respiratory Datamart system began during the 2009 influenza pandemic to collate all laboratory testing information in England. It is now used as a sentinel laboratory surveillance tool, monitoring all major respiratory viruses in England. Seventeen laboratories in England reported data for this season.
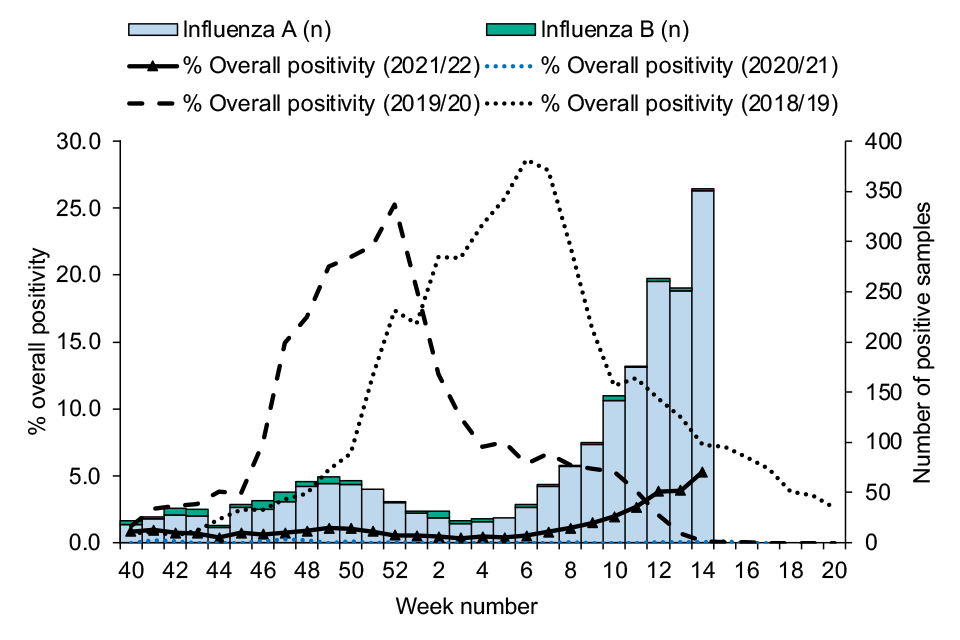
Overall influenza positivity remained low between week 40 of 2021 and week 14 of 2022, with positivity higher than in the 2020 to 2021 season but lower than that observed in pre-pandemic seasons. The majority of detections were influenza A, with some detections of influenza B observed. Of the detected influenza A viruses that were subtyped, the majority were influenza A(H3N2).
An increase in influenza positivity was observed from week 47 of 2021, rising to 1.1% in week 50 of 2022 before declining. This coincides with the introduction of non-pharmaceutical intervention measures to prevent the spread of the Omicron variant of SARS-CoV-2.
Overall influenza positivity began to increase again from week 6 of 2022 and at week 14 of 2022 was at 5.3%, representing a late-season increase in influenza activity.
Comparatively, in 2020 to 2021 detections of influenza through Respiratory DataMart were extremely low, never reaching more than 0.2% of samples tested. This compares to peak positivity of 25.3% in 2019 to 2020 and 28.6% in 2018 to 2019 (Figure 21).
Figure 21. Weekly influenza swab percentage positivity and number of influenza A and B detections through Respiratory Datamart sentinel laboratories in England, 2021 to 2022
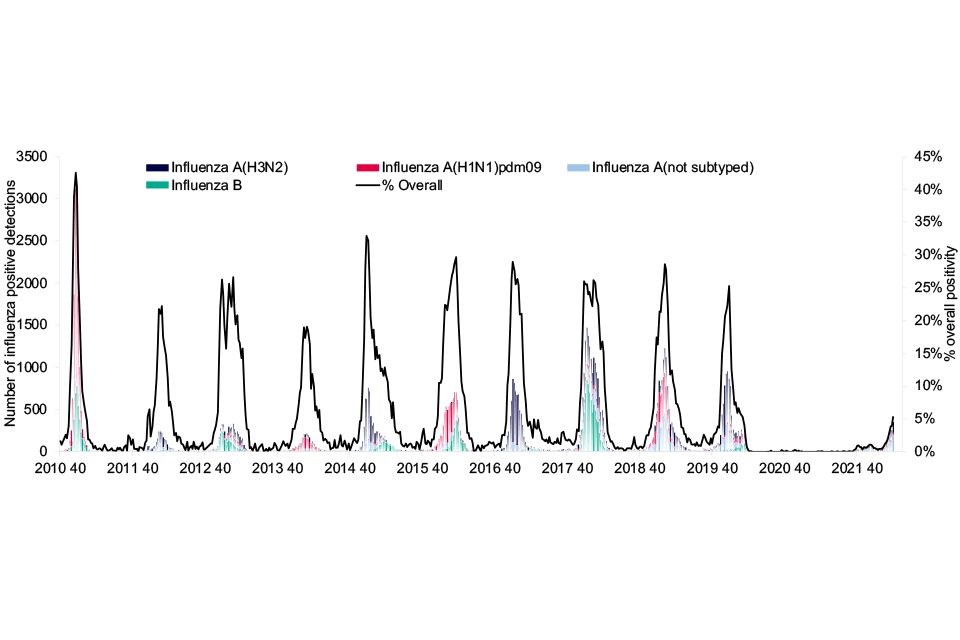
The weekly count of confirmed cases by each major type or subtype of influenza through Respiratory DataMart from winter 2010 onwards is shown in figure 22.
Figure 22. Weekly number of influenza detections by subtype through Respiratory Datamart in England, with overall percentage positivity, 2010 to 2022
In Scotland, overall influenza positivity is reported through non-sentinel sources via Electronic Communication of Surveillance in Scotland (ECOSS). There have been low numbers of influenza diagnoses recorded to date this season with a total of 1,144 samples testing positive for influenza between week 40 of 2021 and week 14 of 2022.
Overall influenza positivity peaked at 2.4% in week 9 of 2022, after which point some late-season activity continued to be observed (Figure 23).
Figure 23. Weekly ECOSS influenza positivity (percentage and number positive) by influenza subtype from week 40 of 2021 to week 14 of 2022, Scotland
Respiratory syncytial virus (RSV)
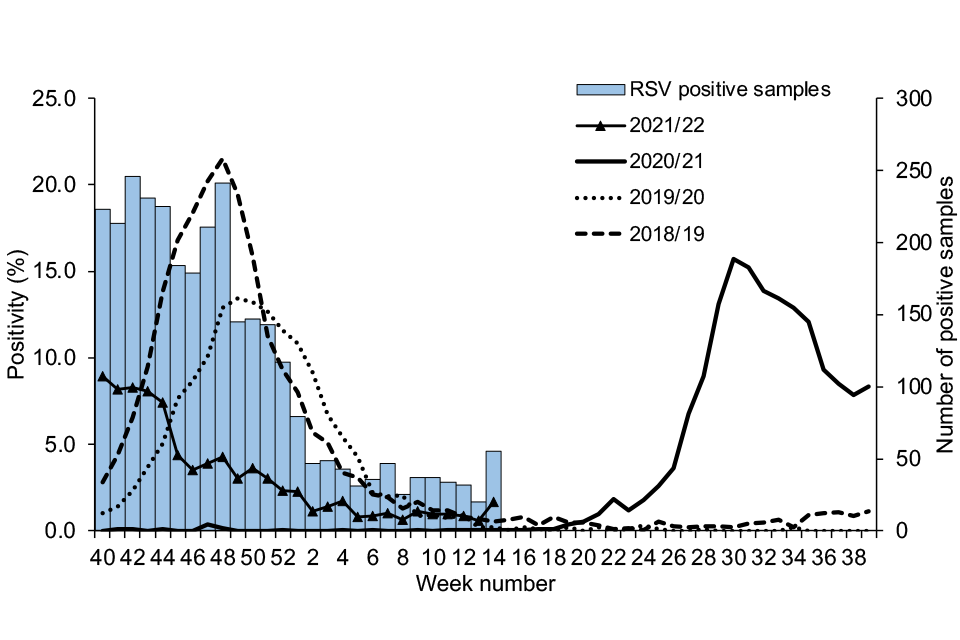
From week 40 2021 to week 14 2022, respiratory syncytial virus (RSV) detections reported through the Respiratory DataMart surveillance system largely remained relatively low and below usual seasonally expected levels.
Positivity was higher than that observed during the 2020 to 2021 season, however was generally lower than that of previous seasons. Importantly, out-of-season increases in RSV were observed during the summer of 2021 as COVID-19 control measures eased, with RSV swab positivity peaking in week 30 of 2021 at 15.7%.
This is not directly comparable to peak positivity in previous seasons as this includes additional RSV testing carried out from May 2021 to week 39 of 2021 in Public Health England (now UKHSA) regional laboratories for any available respiratory swabs in children aged 0 to 5 years (including those done for COVID-19 screening as well as those taken in line with routine practice for clinical diagnosis of acute respiratory illness).
From week 30 of 2021 to week 13 of 2022, a general declining trend was observed before a slight increase in week 14. Comparatively, RSV positivity through DataMart remained very low during winter 2020 to 2021, with positivity never exceeding 0.4%. This compares with positivity peaks of 13.4% in 2019 to 2020, 21.5% in 2018 to 2019 and 20.9% in 2017 to 2018 (Figure 24).
Surveillance of RSV is ongoing with further data of current trends published in the weekly national influenza and COVID-19 surveillance report.
Figure 24. Weekly overall RSV swab percentage positivity and number of detections through Respiratory DataMart in England, 2021 to 2022
In Scotland, respiratory syncytial virus (RSV) was the second most commonly detected non-influenza respiratory pathogen with 1.02% positive samples (1,636 detections out of 159,718) detected through non-sentinel sources (ECOSS) for the 2021 to 2022 season (up to week 14 of 2022).
In line with patterns observed in England, early RSV activity during the summer of 2021 was also observed in Scotland.
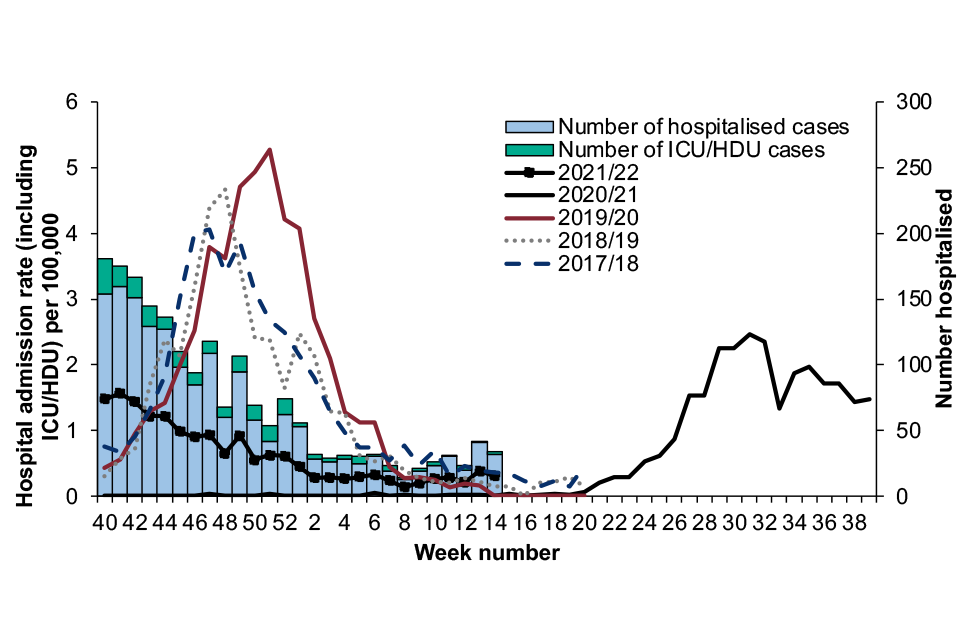
England collates data on confirmed hospitalised RSV cases through the SARI Watch surveillance system. For RSV, this is a sentinel surveillance system.
Between week 40 2021 and week 14 2022, a total of 1,922 confirmed RSV cases (1,717 hospitalised to lower level of care and 205 admitted to ICU or HDU) were reported from 38 participating sentinel trusts.
The cumulative admission rate between week 40 and week 14 was 11.96 per 100,000 trust catchment population in 2021 to 2022. This compares to 0.13 per 100,000 in 2020 to 2021, 37.04 per 100,000 in 2019 to 2020, 34.07 per 100,000 in 2018 to 2019 and 31.83 per 100,000 in 2017 to 2018.
It is again important to consider that RSV activity during the inter-seasonal period from week 20 to week 39 of 2021 was higher than previously observed, as RSV transmission rebounded as COVID-19 control measures eased, resulting in a prolonged season.
Out-of-season increases in RSV hospitalisations were seen from week 20 of 2021, peaking during week 31 2021 at 2.46 admissions per 100,000 (lower level of care and ICU or HDU). From this point, the rate of hospitalisation with RSV began to decline until week 9 of 2022 where slight increases have since been noted.
For comparison, peak weekly admission rates for RSV (lower level of care and ICU or HDU) were observed at 0.07 per 100,000 in 2020 to 2021, 5.28 per 100,000 in 2019 to 2020, 4.67 per 100,000 in 2018 to 2019 and 4.06 per 100,000 in 2017 to 2018 (Figure 25).
Figure 25. Weekly hospitalised RSV case rate per 100,00 trust catchment population and number of admissions to sentinel Trusts, England, week 40, 2021 to week 14, 2022
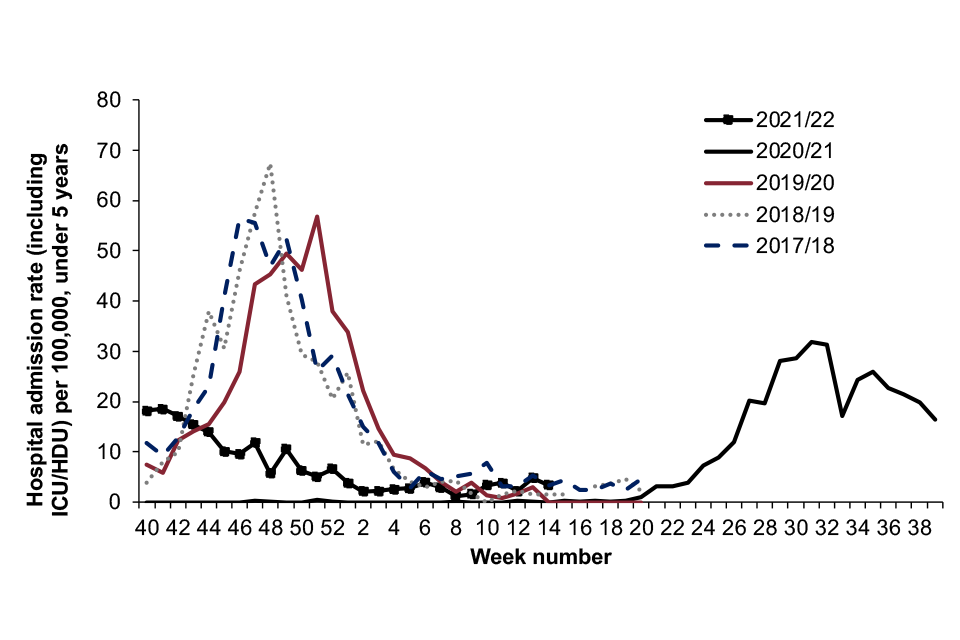
Children under the age of 5 are most affected by RSV. Activity peaked prior to the season in week 31 2021 at 31.8 per 100,000 hospital admissions (lower level of care and ICU or HDU).
During the 2021 to 2022 season, hospitalisation rates for RSV in this age group followed the same overall trend. Rates continued to decline steadily, remaining below 5 admissions per 100,000 from week 1 to week 14 of 2022.
For comparison, the RSV hospitalisation rate in under 5 year olds peaked at 56.7 per 100,000 in week 51 of the 2019 to 2020 season and at 67.4 per 100,000 in week 48 of the 2018 to 2019 season, and 56.4 per 100,000 in week 46 of the 2017 to 2018 season.
In the 2021 to 2022 season from week 40 to week 14 inclusive, there were 1,401 RSV hospitalisations (lower level of care or ICU or HDU admissions) to SARI-Watch sentinel Trusts in those aged under 5. Of these, 59.0% (826) were in children aged under 1 year, including 621 aged 6 months or younger.
Figure 26. Rate of RSV hospitalisation in under 5 years per 100,000 trust catchment population by week of admission and season, sentinel data from acute NHS trusts, England
Other seasonal respiratory viruses
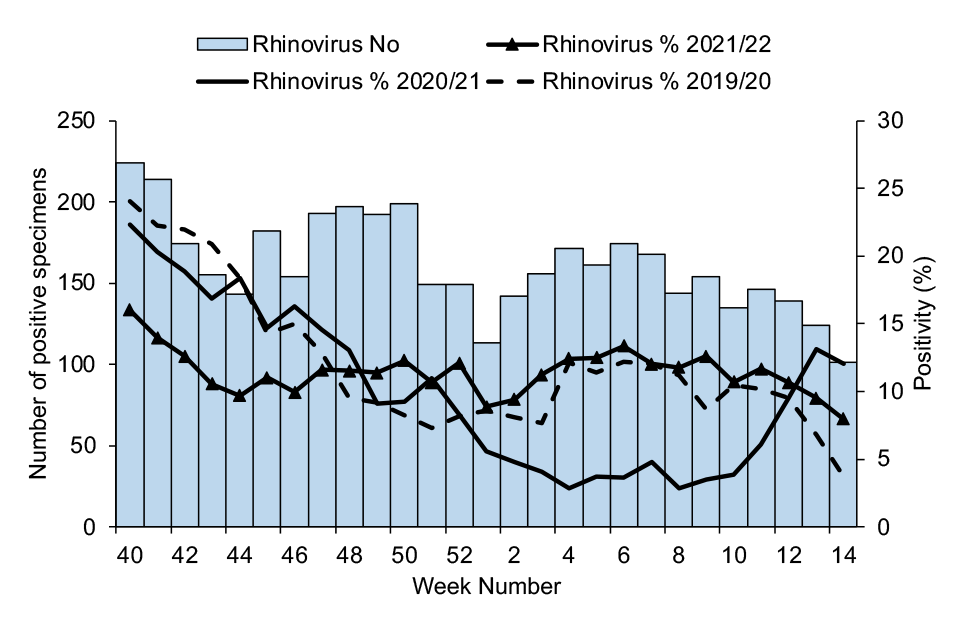
Of the other respiratory viruses monitored through the respiratory DataMart system, the highest levels of positivity were observed with rhinovirus throughout the season. Rhinovirus positivity was highest at the beginning of the season, although lower than at this point in the 2019 to 2020 and the 2020 to 2021 seasons.
From late 2021 onwards, rhinovirus activity was similar to that seen in 2019 to 2020, and higher than the positivity levels observed in 2020 to 2021. Activity remained relatively stable at between 10% to 13% positivity through the majority of the season, with decreases seen from week 12 2022 (Figure 27).
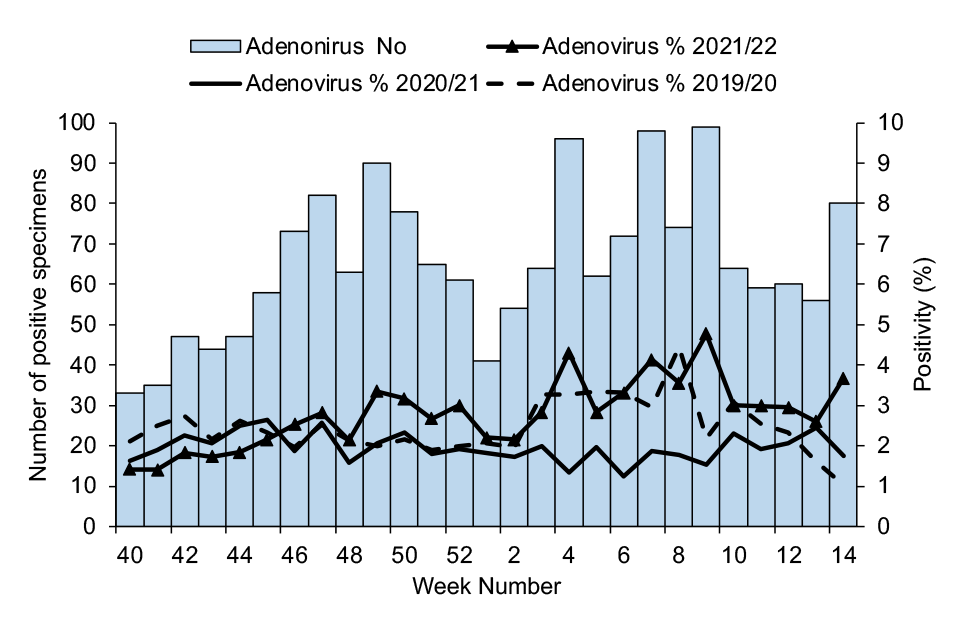
Consistent with previous seasons, low levels of adenovirus were observed throughout the season with no clear seasonality seen, although positivity was slightly elevated between weeks 4 and 14 of 2022.
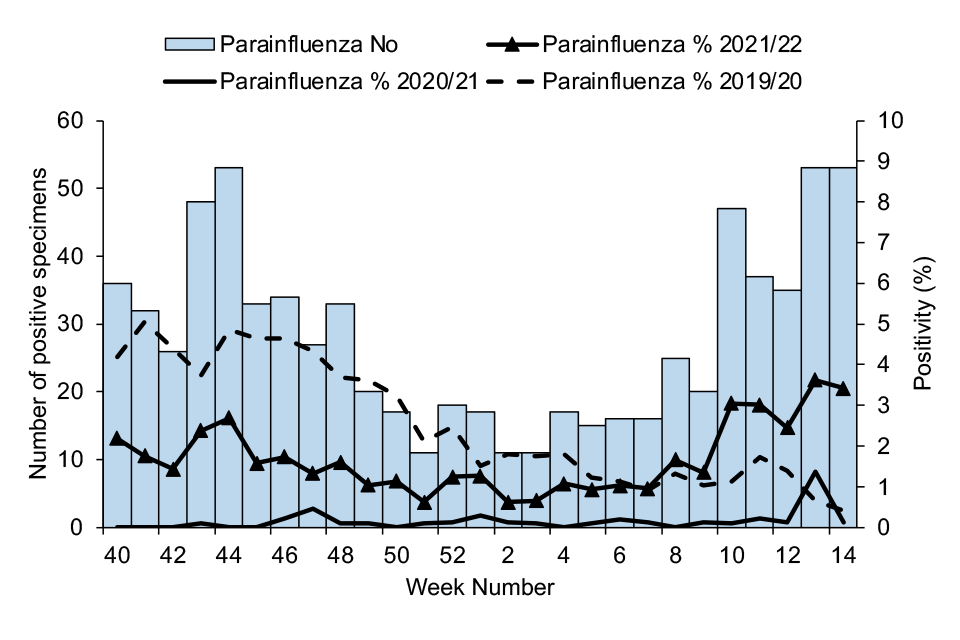
Parainfluenza positivity was higher than that observed in 2020 to 2021, however was lower than activity seen in 2019 to 2020 from week 40 2021 to week 7 2022. From week 8 2022 onwards, activity has been higher than that observed in previous seasons, although remains relatively low overall.
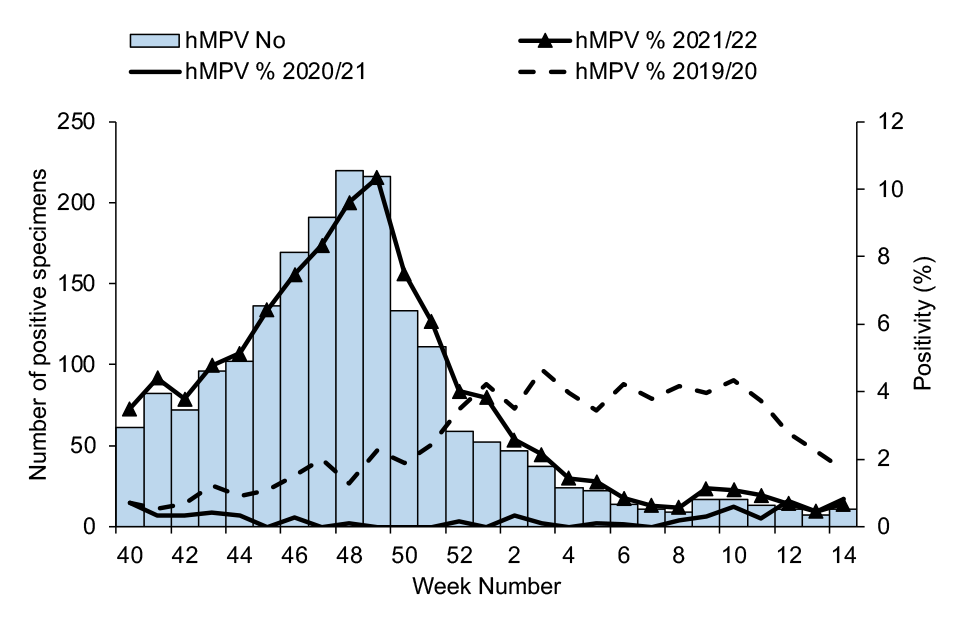
Human metapneumovirus (hMPV) activity in 2021 to 2022 was elevated at the start of the season compared to the previous 2 seasons, peaking in week 49 at 10.3% positivity. From this point, positivity decreased and from week 1 2022 remained below the levels observed during the same period in 2019 to 2020 and higher than or comparable to those of 2020 to 2021 (Figure 27).
Figure 27. Weekly number of positive samples and proportion positive for other respiratory viruses, DataMart sentinel laboratories, England, 2019 to 2022
(a) Adenovirus
(b) Parainfluenza
(c) Rhinovirus
(d) Human Metapneumovirus (hMPV)
In Scotland, the pattern of non-influenza respiratory pathogens detected through ECOSS for 2021 to 2022 season (up to week 14 of 2022), was not similar to that seen in the previous 2 seasons (2019 to 2020 and 2020 to 2021).
Of 159,718 samples, rhinovirus was the most common non-influenza respiratory pathogen (5,134 detections, 3.3% positive samples) detected through non-sentinel sources (ECOSS). RSV was the second most common non-influenza pathogen followed by hMPV (1,431 detections, 0.9% positive samples), seasonal coronavirus (non-SARS-CoV-2) (1,399 detections, 0.9% positive samples), adenovirus (1,374 detections, 0.9% positive samples) and parainfluenza (1,043 detections, 0.7% positive samples).
Mycoplasma pneumoniae (MPN) was the lowest detected non-viral pathogen (8 detections, 0.01% positivity).
In Wales, between week 40 of 2021 and week 14 of 2022, 48,952 hospital and non-sentinel GP samples were routinely tested for influenza, RSV, adenovirus, Mycoplasma pneumoniae, rhinovirus, parainfluenza, enterovirus, hMPV and SARS-CoV-2. An additional 140,506 samples were tested only for influenza, RSV and SARS-CoV2 (using a rapid test system).
The 2 most commonly detected non-influenza respiratory pathogens were rhinovirus (5,884 out of 48,952 detections, 12.0% positive samples) and SARS-CoV-2 (19,090 out of 189,458 detections, 10.1% positive samples).
Other detected causes of respiratory infection included adenovirus (3.4%), human metapneumovirus (3.4%), enterovirus (3.2%), parainfluenza (1.7%), RSV (1.3%) and mycoplasma (under 0.1%).
Preceding, co- and secondary respiratory infections with SARS-CoV-2
Seasonal respiratory virus co-infections are defined as a patient with a sample testing positive for the viral organism and another sample testing positive for SARS-CoV-2 within one day of each other. Preceding and secondary infection definitions for these organisms are defined as the pathogen occurring 2 to 28 days pre- or post-SARS-CoV-2 infection.
Please note that undertesting of pathogens may result in an underestimate of preceding, co- and secondary infection cases. Furthermore, children receiving the LAIV in the preceding 14 days prior to swabbing may result in positive influenza detection in the absence of infection.
Full pre-, co- and secondary infection definitions are available in Appendix 1 of the National flu and COVID-19 surveillance graphs packs.
Between week 40 2021 and week 14 2022, 86 co-infections of influenza A and SARS-CoV-2 and 35 co-infections of influenza B and SARS-CoV-2 were identified in England via the Respiratory DataMart and SGSS systems. A total of 56 preceding and 82 secondary influenza A infections were reported in comparison to 23 preceding and 18 secondary influenza B infections.
These numbers remain low but are an increase on last season (Figure 28), where between week 40 2020 and week 14 2021, 10 influenza A co-infections and 14 influenza B co-infections were recorded. There were 7 secondary influenza A and 6 secondary influenza B infections recorded and less than 5 preceding infections identified for each organism.
Please note an extensive data validation exercise has identified additional respiratory viral specimens from Respiratory Datamart for the 2020 to 2021 season. .
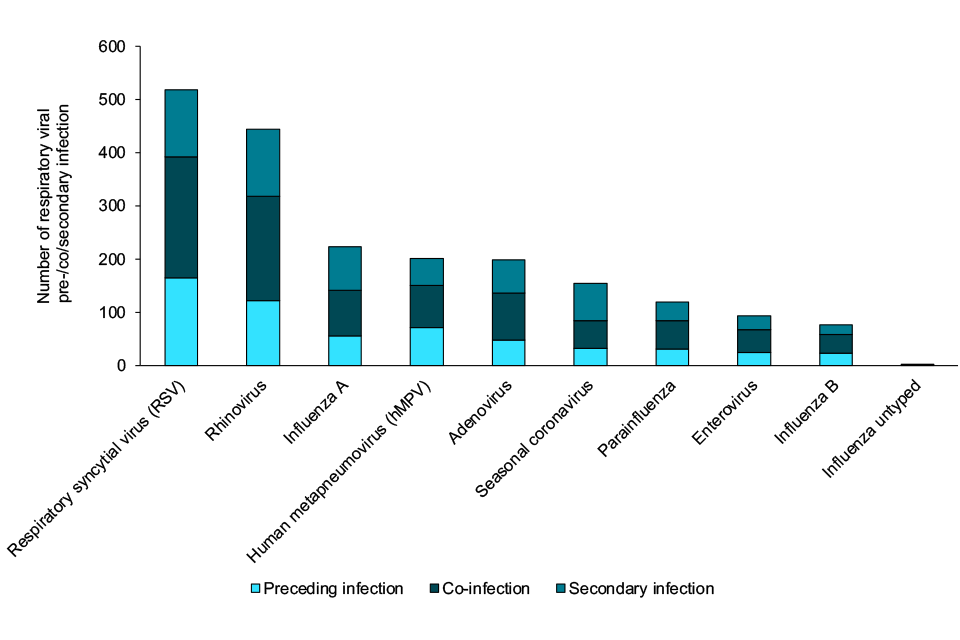
Between week 40 2021 and week 14 2022, the most frequent viral organisms (preceding, co- or secondary infections) identified from respiratory specimens amongst persons with COVID-19 were RSV, rhinovirus and influenza A (Figure 28).
RSV was the most commonly detected pre-, co- and secondary infection accounting for 25.5% of all pre-, co- and secondary infections, followed by rhinovirus which accounted for 21.8%. A total of 2,033 pre-, co- and secondary infections were detected across all seasonal respiratory viruses in the 2021 to 2022 season.
Figure 28. Weekly number of respiratory viral specimens, by timing of diagnosis, in persons with COVID-19 diagnosed in England, 2020 to 2022
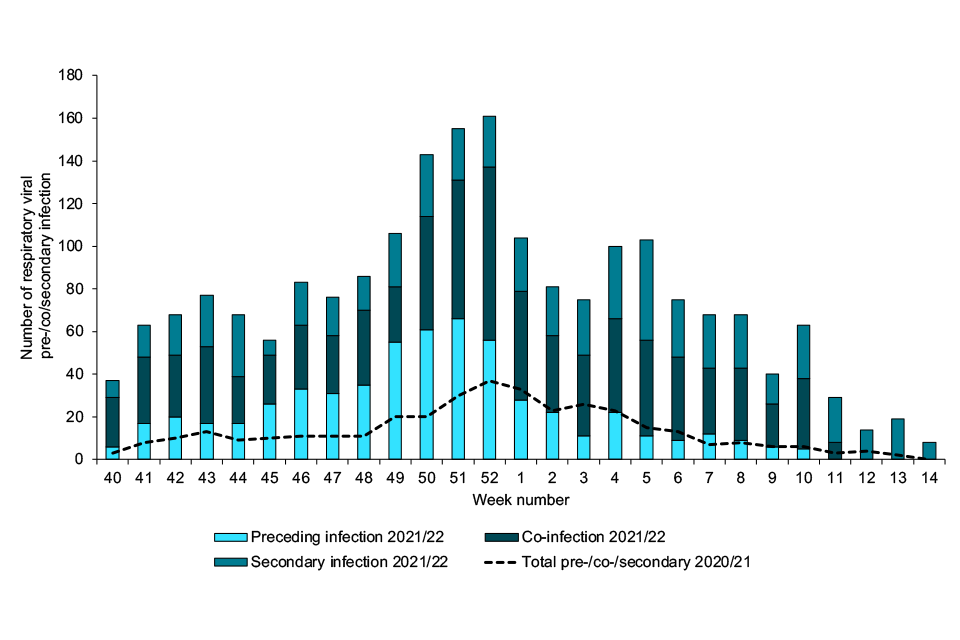
Figure 29. Most frequent respiratory viral specimens, by timing of diagnosis, in persons with COVID-19 diagnosed in England between week 40 2021 and week 14 2022
Sentinel GP-based swabbing
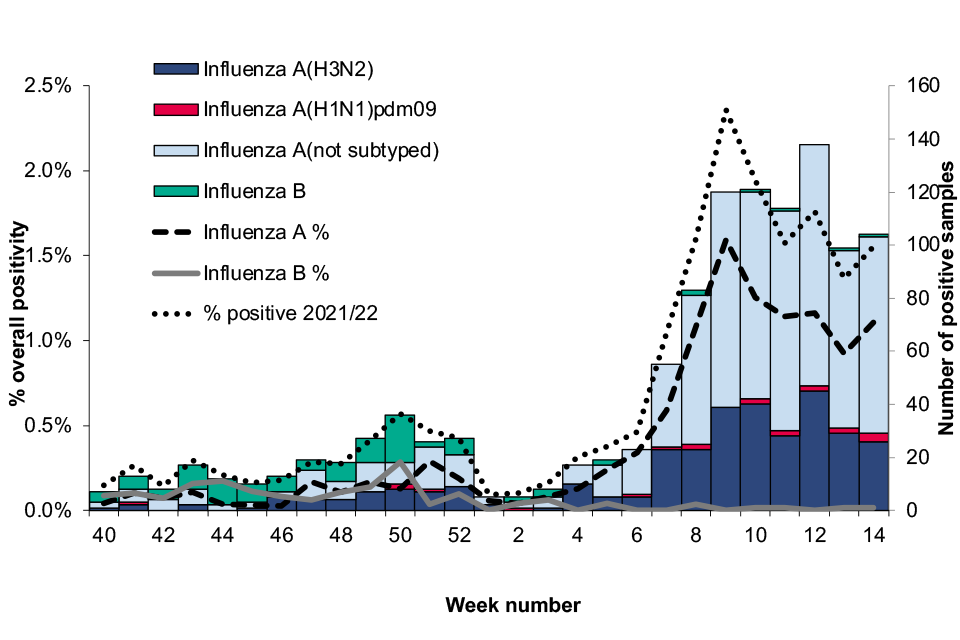
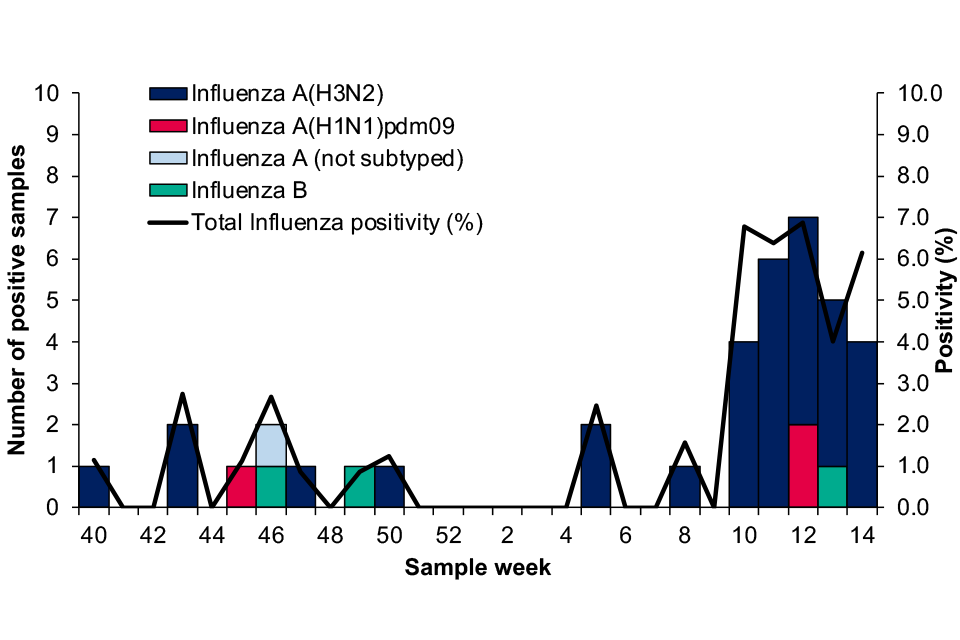
In England, influenza activity through the GP sentinel swabbing scheme in collaboration with the RCGP was low overall in comparison to seasons prior to the COVID-19 pandemic, with a total of 37 positive samples between week 40 of 2021 and week 14 of 2022.
Activity began to increase in week 10 of 2022. Influenza A(H3N2) accounted for the majority of positive influenza specimens (Figure 30).
Figure 30. Number of influenza positive samples and weekly positivity (%) by influenza type
In Northern Ireland, 2 specimens tested positive for influenza during the 2021 to 2022 season through GP sentinel swabbing, in week 9 and week 12 respectively. Both were influenza A(H3N2).
In Scotland, between week 40 of 2021 and week 14 of 2022 there were 72 detections of influenza through GP sentinel swabbing, 54 of which were Influenza A(H3N2). Positivity was calculated from week 44 of 2021 onwards and peaked in week 10 of 2022 at 24.6%.
In Wales, 5 specimens tested positive for influenza during the 2021 to 2022 season through GP sentinel swabbing. Of these, 1 was influenza B in week 48 of 2021, and 4 were influenza A(H3N2) between weeks 10 to 14 of 2022.
Virus characterisation
UKHSA characterises the properties of influenza viruses through one or more tests, including genome sequencing (genetic analysis) and haemagglutination inhibition (HI) assays (antigenic analysis).
This data is used to compare how similar the currently circulating influenza viruses are to the strains included in seasonal influenza vaccines, and to monitor for changes in circulating influenza viruses.
The interpretation of genetic and antigenic data sources is complex due to a number of factors, for example, not all viruses can be cultivated in sufficient quantity for antigenic characterisation, so that viruses with sequence information may not be able to be antigenically characterised as well.
Occasionally, this can lead to a biased view of the properties of circulating viruses, as the viruses which can be recovered and analysed antigenically, may not be fully representative of majority variants, and genetic characterisation data does not always predict the antigenic characterisation.
The UKHSA Respiratory Virus Unit has genetically characterised 362 influenza A(H3N2) viruses, collected since week 40 of 2021. Of the characterised influenza A(H3N2) viruses where the age of the individual sampled is known, 54% are from individuals in age groups that would not normally be eligible for influenza vaccination.
Sequencing of the haemagglutinin (HA) gene shows that these A(H3N2) viruses belong in genetic subclade 3C.2a1b, 352 within a cluster designated 3C.2a1b.2a.2.
The Northern Hemisphere 2021 to 22 influenza A(H3N2) vaccine strain (an A/Cambodia/e0826360/2020-like virus) also belongs in genetic subclade 3C.2a1b, within the 2a.1 genetic group.
Ten A(H3N2) viruses collected between week 50 of 2021 and week 4 of 2022 fall within a cluster designated 3C.2a1b.1a. Viruses within this genetic cluster have been detected in recent months in west and South Africa.
Eleven influenza B viruses, collected since the start of the season in week 40 of 2021 have been genetically characterised and belong in genetic clade 1A.3 of the B/Victoria lineage, characterised by deletion of three amino acids in the haemagglutinin (HA), in a subgroup designated 1A.3a.2.
The Northern Hemisphere 2021 to 22 B/Victoria-lineage quadrivalent and trivalent vaccine component virus (a B/Washington/02/2019-like virus) belongs in genetic clade 1A.3.
Twenty-three influenza A(H1N1)pdm09 viruses have been characterised to date this season, belonging in genetic subgroup 6B.1A.5a. Four fall within a cluster designated 6B.1A.5a.1, with 2 collected from returning travellers. Nineteen A(H1N1)pdm09 viruses also belong in genetic subgroup 6B.1A.5a, within a cluster designated 6B.1A.5a.2.
The Northern Hemisphere 2021 to 22 influenza A(H1N1)pdm09 vaccine strain (an A/Victoria/2570/2019-like virus) also belongs in genetic subclade 6B.1A.5a, within the 6B.1A.5a.2 cluster.
The detection of circulating A(H3N2) and influenza B viruses is in accordance with predominant detections internationally over the period of August and September 2021, and from week 40 to week 14.
The Respiratory Virus Unit has confirmed by genome sequencing the detection of LAIV viruses in 39 influenza A and or influenza B positive samples collected since week 37 of 2021, from children aged 2 to ≤16 years of age.
Virus characterisation in Scotland is performed by the West of Scotland laboratory throughout the influenza season.
This data is published in the weekly report.
Antiviral susceptibility
Influenza positive samples are screened for mutations in the virus neuraminidase (NA) and the cap-dependent endonuclease (PA) genes known to confer neuraminidase inhibitor or baloxavir resistance, respectively.
The samples tested are routinely obtained for surveillance purposes, but diagnostic testing of patients suspected to be infected with antiviral-resistant virus is also performed.
Influenza virus sequences from samples collected between week 40 of 2021 and week 10 of 2022 have been analysed. No viruses with known markers of resistance to neuraminidase inhibitors were detected in 309 A(H3N2), 17 A(H1N1)pdm09 and 11 B/Victoria-lineage neuraminidase gene sequences. No viruses with known markers of resistance to baloxavir marboxil were detected in 14 A(H1N1)pdm09 and 10 B/Victoria-lineage PA gene sequences (cap-dependent endonuclease).
Of 277 A(H3N2) PA gene sequences, 275 had no markers of resistance to baloxavir, however 2 sequences were identified with an E199G amino acid substitution
The E199G substitution has been reported previously as causing a minor reduction in baloxavir susceptibility (4.4-fold) in vitro, detected post treatment in a phase 2 paediatric study.
For the 2 viruses identified with this substitution, the first was present as a mixed population (37% E199G) in a sample taken from a child in mid-January. The second virus had the E199G substation present at 100% and was detected in an adult. No clinical details are available yet.
Table 2. Antiviral susceptibility of influenza positive samples tested at UKHSA-RVU
| Neuraminidase Inhibitors | ||
|---|---|---|
| (Sub)type | Susceptible | Reduced Susceptibility |
| A(H3N2) | 309 | 0 |
| A(H1N1)pdm09 | 17 | 0 |
| B/Victoria-lineage | 11 | 0 |
| Baloxavir | ||
|---|---|---|
| (Sub)type | Susceptible | Reduced Susceptibility |
| A(H3N2) | 275 | 2 |
| A(H1N1)pdm09 | 14 | 0 |
| B/Victoria-lineage | 10 | 0 |
Mortality
Excess all-cause mortality surveillance
Excess mortality is defined as a significant number of deaths reported over that expected for a given point in the year based on historical patterns, allowing for weekly variation in the number of deaths.
The UK uses the European monitoring of excess mortality (EuroMOMO) algorithm to estimate weekly all-cause excess mortality. This algorithm allows for direct comparison between excess mortality estimates in the countries of the UK.
The number of deaths by date of death is corrected by reporting delay and excess determined by week of death, avoiding the effect of bank holidays.
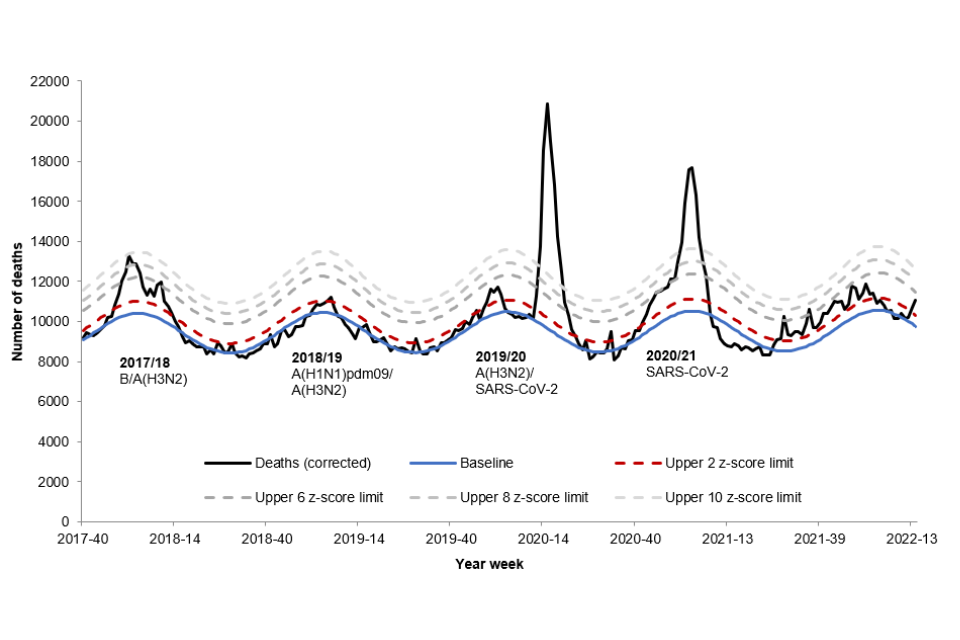
During 2021 to 2022, up to week 14, 2022 excess mortality was seen in England in all ages between from week 40 to week 2, and again in weeks 13 and 14 (Table 3).
The excess mortality observed up to week 2 is significantly lower than the levels observed in 2019 to 2020 and 2020 to 2021 which were largely attributed to deaths related to COVID-19 (Figure 31).
Across the devolved administrations of the UK, modelled estimates using the EuroMOMO model showed excess mortality in all ages for Scotland, Wales and Northern Ireland (Table 3). Further information can be found on the EuroMOMO website.
Table 3. Weeks with excess mortality observed in 2021 to 2022 (up to week 14) in the UK
| Country | Weeks with excess in 2021 to 2022 |
|---|---|
| England | 40 to 2, 13 to 14 |
| Wales | 40, 42 to 43, 45, 51 |
| Northern Ireland | 43 to 44, 46 to 50, 52, 13 to 14 |
| Scotland | 40 to 41, 45, 47 to 49, 52, 2 |
Figure 31. Weekly observed and expected number of all-age all-cause deaths, with the dominant circulating strain type(s), England, 2015 to 2022
Vaccination
Seasonal influenza vaccine uptake in adults
Although all countries of the UK use standardised specifications to extract vaccine uptake data from IT information systems in primary care (GP system suppliers), there are some differences in extraction specifications, so comparisons should be made with caution.
England
In England, the uptake of seasonal influenza vaccine is monitored by UKHSA throughout the season based on weekly and monthly extracts from GP system suppliers via ImmForm for the cohorts primarily delivered via the GP practice.
Cumulative uptake on influenza vaccinations administered up to 28 February 2022 was reported from 97.1% (6,355 out of 6,542) of GP practices in England in 2021 to 2022.
Comparative data are up to 28 February 2021 where vaccine uptake was reported from 97.6% (6,438 out of 6,596) of GP practices in England in 2020 to 2021.
This season saw a vaccine uptake of 82.3% in those 65 and over (compared to 80.9% in 2020 to 2021) and 52.9% for those aged 6 months to under 65 years of age with one or more underlying clinical risk factors (excluding pregnant women without other risk factors and carers), compared to 53.0% in 2020 to 2021 (Table 4).
Vaccine uptake in pregnant women was 37.9%, compared to 43.6% in 2020 to 2021. In the 2020 to 2021 season, the programme was extended for a second season to include all 50 to under 65 year olds not at-risk. Vaccine uptake in this group was 45.7%, but data between seasons for this age group is not directly comparable to the 2020 to 2021 season due to the current season eligibility starting 3 months earlier than last season.
Scotland
In Scotland, the uptake of seasonal influenza vaccine is estimated by PHS throughout the season, using a combination of (i) aggregated data returns submitted by staff in all the territorial NHS boards on a weekly basis for those eligible in the following cohorts: 6 months to 2 years at risk, 2 to 5 years not at school, primary and secondary school pupils and pregnant women, and (ii) weekly extracts of data downloaded from the national clinical data store (NCDS) which contains individual-level data for adults eligible for flu vaccine, and for one NHS board, the data relating to the childhood schools’ and nurseries’ programmes.
At this time, the vaccine uptake data reported is not comparable to previous years which reflects the improvements in data recording but also changes in how uptake has been determined in some cohorts.
It is estimated that at least 2,706,968 individuals received influenza vaccine, as reported to PHS. Cumulative uptake to week 15, 2022 for the 2021 to 2022 season indicates that for those aged 65 years and over the uptake is 90.2%. This compares to 79.6% in the previous season.
Uptake amongst those aged 18 to 64 years in one or more clinical at-risk groups was 62.4%. Overall uptake in pregnant women (including those with and without other risk factors) up to week 15, 2022 was 55.2%, compared to 53.3% and 44% in the previous 2 seasons (2020 to 2021 and 2019 to 2020).
There is some indication that co-administration of the flu and COVID-19 vaccines may have contributed to improved uptake during the past season.
Data is presented in Scotland’s weekly national respiratory report.
Wales
In Wales, the uptake of seasonal influenza vaccine is monitored on a weekly basis by Public Health Wales throughout the season, based on automated weekly extracts of Read coded data using software installed in all general practices in Wales, collected through the Audit+ Data Quality System.
Cumulative uptake data on influenza vaccinations administered were received from 100% of GP practices in Wales in 2021 to 2022. This showed a vaccine uptake of 78.0% in 65 year olds and over (compared to 76.5% in 2020 to 2021) and 48.2% for those aged 6 months to under 65 years of age with one or more underlying clinical risk factors, compared to 51.0% in 2020 to 2021.
Uptake in all patients aged 50 to 64 years old was 42.4% (288,862 vaccinated out of 680,934). Overall uptake in pregnant women was 78.5% compared to 81.5% in 2020 to 2021. In Wales, vaccine coverage in pregnant women is measured differently using a survey of pregnant women giving birth each year during January.
In addition, as elsewhere in the UK, data are also automatically collected from general practices for women with pregnancy related Read codes, these data report uptakes of 51.3% in pregnant women at risk and 38.0% in healthy pregnant women.
Northern Ireland
In Northern Ireland, the uptake of seasonal influenza vaccine is monitored by the Public Health Agency (PHA) of Northern Ireland. This season influenza vaccine uptake was determined using data extracted from the regional Immunisation Information System developed by the Department of Health Digital team, known as the Vaccine Management System (VMS).
Influenza vaccination was introduced into the VMS in August 2021. Caution should be used when considering the 2021 to 2022 influenza vaccination uptake rates in comparison to previous seasons, due to the introduction of the new VMS involving new methods of recording and extracting influenza vaccine data.
In the population aged 65 years and over, uptake was 54.5% (compared to 79.1% in 2020 to 2021). Uptake was 37.5% in the population of 50 to 64 year olds. 2020 to 2021 was the first year of roll out in this age group, when 21,931 vaccinations were undertaken (denominator not available).
In the population of under 50 years at risk the uptake was 51.7%, (82,029 vaccinations out of 158,631) (no previous comparable reporting group). Note that the VMS does not currently collect data on the specific clinical risk conditions for influenza vaccination, therefore the number vaccinated aged under 50 years was used as proxy for those aged under 50 years ‘at risk’.
Uptake in pregnant women was 45.9% compared to 50.0% in 2020 to 2021.
Healthcare workers
In England, vaccine uptake among frontline healthcare workers was 61.4%. In Trusts, vaccine uptake was 60.5% (from 78.5% of Trusts responding), a decrease from 76.5% vaccine uptake in 2020 to 2021. In GP practice (including ISHCPs), vaccine uptake was 74.1% (from 22.7% of GP practices and ISHCPs responding), a decrease from 81.6% vaccine uptake in 2020 to 2021.
In Scotland, uptake among health care staff was 67.3% and among social care staff was 49.3% during the 2021 to 22 season. The combined vaccine uptake in health and social care workers was 58.8%.
In Wales, uptake reached 57.2% compared to 65.6% in 2020 to 2021.
In Northern Ireland, uptake in all healthcare workers including social care workers (working within the 5 health and social care Trusts and the Northern Ireland Ambulance Service) was 41.8%. This is not directly comparable to previous seasons during which uptake in frontline health and social care workers was reported (49.8% in 2020 to 2021). It was not possible to disaggregate data to exclude social care workers.
Table 4. Vaccine uptake in target groups in the UK
| England | |||
|---|---|---|---|
| Target group | Number vaccinated | Denominator | % uptake |
| 65 years and over | 8,773,058 | 10,653,768 | 82.3 |
| 6 months to under 65 years at risk | 4,305,656 | 8,132,906 | 52.9 |
| Pregnant - No risk | 204,226 | 567,293 | 36 |
| Pregnant - At risk** | 40,403 | 77,992 | 51.8 |
| Pregnant - All | 244,629 | 645,285 | 37.9 |
| Frontline Healthcare Workers*** | 561,833 | 915,773 | 61.4 |
| Scotland | |||
|---|---|---|---|
| Target groups | Number vaccinated | Denominator | % uptake |
| 65 years and over | 952,606 | 1,056,080 | 90.2 |
| 6 months to under 65 years at risk | 536,854 | 860,412 | 62.4 |
| Pregnant - No risk | - | - | - |
| Pregnant - At risk** | - | - | - |
| Pregnant - All | 20,771 | 37,605 | 55.2 |
| Frontline Healthcare Workers *** | 119,813 | 178,048 | 67.3 |
| Wales | |||
|---|---|---|---|
| Target group | Number vaccinated | Denominator | % uptake |
| 65 years and over | 535,876 | 687,339 | 78 |
| 6 months to under 65 years at risk | 215,332 | 446,772 | 48.2 |
| Pregnant - No risk | 7,113 | 18,724 | 38 |
| Pregnant - At risk** | 1,236 | 2,409 | 51.3 |
| Pregnant - All† | 307 | 391 | 78.5 |
| Frontline Healthcare Workers *** | 35,399 | 61,867 | 57.2 |
| Northern Ireland | |||
|---|---|---|---|
| Target group | Number vaccinated | Denominator | % uptake |
| 65 years and over | 184,956 | 339,119 | 54.5 |
| 6 months to under 65 years at risk | - | - | - |
| Pregnant - No risk | - | - | - |
| Pregnant - At risk** | - | - | - |
| Pregnant - All | 4,906 | 10,682 | 45.9 |
| Frontline Healthcare Workers *** | 36,051 | 86,270 | 41.8 |
**The pregnant women at-risk are included in the under-65 years at risk category
***Excludes social care workers for England, Wales and Scotland. Includes frontline and non-frontline health and social care workers for Northern Ireland
†In Wales, vaccine coverage in pregnant women is measured differently using a survey of pregnant women giving birth each year during January
Influenza vaccine (LAIV) programme for children
England
The influenza vaccine uptake in 2 and 3 year olds in England is monitored by UKHSA throughout the season, through weekly and monthly extracts from GP system suppliers via ImmForm. Cumulative vaccine uptake on influenza vaccinations administered up to 28 February 2022 was reported from 97.1% (6,347 out of 6,538) of GP practices in England in 2021 to 2022.
Comparative data are up to 28 February 2021 where vaccine uptake was reported from 97.2% (6,406 out of 6,592) of GP practices in England in 2020 to 2021. This season saw a vaccine uptake for all GP-registered 2 year olds of 48.7% (compared to 55.3% in 2020 to 2021) and was 51.4% in 3 year-olds (compared to 58% in 2020 to 2021) in England.
The combined uptake for 2 and 3 year olds was 50.1% compared to 56.7% in 2020 to 2021.
In the 2021 to 2022 season, the influenza vaccine programme for school aged children was extended to include all children in secondary school (all children from reception to year 11, aged 4 to 16 years old).
The programme was mainly delivered via a school-based route, with one area (Isle of Scilly) delivering vaccinations through general practice. Vaccine uptake was monitored through manual returns by local teams for their responsible population.
An estimated 4,129,981 children in school years reception to year 11 (age 4 to 16 years old) in England received at least one dose of influenza vaccine during the period 1 September 2021 to 31 January 2022. With an estimated total target population of 7,986,411, the overall uptake was 51.7%.
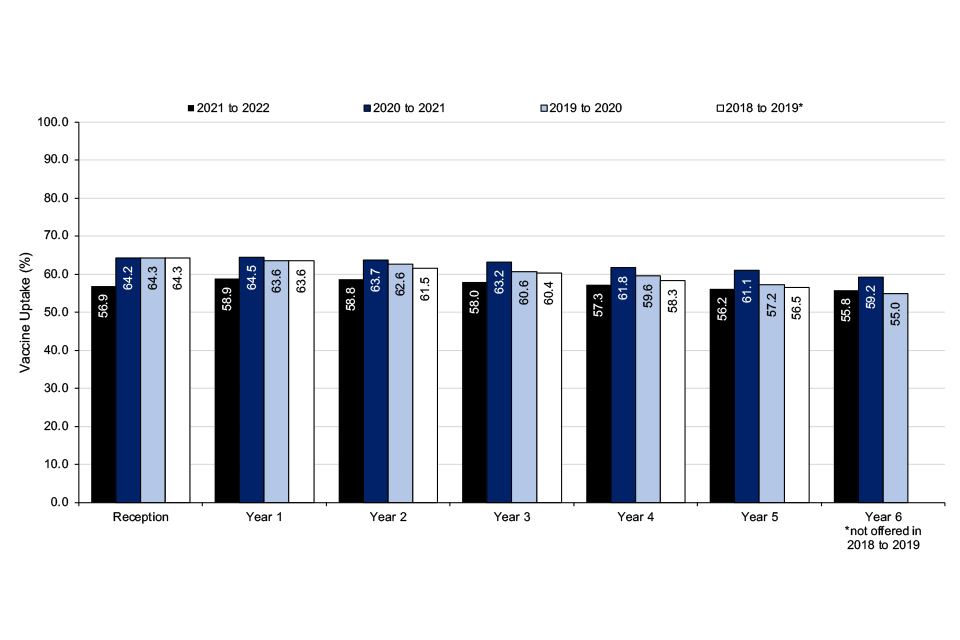
Vaccine uptake in all primary school age children (age 4 to 11 years old) was 57.4% compared to 61.9% in 2020 to 2021 (Table 5). Vaccine uptake in all secondary school age children (age 11 to 16 years old) was 43.6% (Table 5).
Vaccine uptake in children of school age reception to year 11 decreases with increasing age, this trend has been seen in the 4 previous years where comparable data is available (Table 5 and Figure 32).
Table 5. Percentage influenza vaccine uptake in children of school age: reception to year 11 (age 4 to 16 years old) in England
| Age group | 2021 to 2022 Percentage vaccine uptake | 2020 to 2021 Percentage vaccine uptake |
|---|---|---|
| Reception (age 4 to 5 years) | 56.9 | 63.5 |
| Year 1 (age 5 to 6 years) | 58.9 | 63.9 |
| Year 2 (age 6 to 7 years) | 58.8 | 63.2 |
| Year 3 (age 7 to 8 years) | 58.0 | 62.6 |
| Year 4 (age 8 to 9 years) | 57.3 | 61.2 |
| Year 5 (age 9 to 10 years) | 56.2 | 60.5 |
| Year 6 (age 10 to 11 years) | 55.8 | 58.5 |
| Year 7 (age 11 to 12 years) | 48.5 | 55.5 |
| Year 8 (age 12 to 13 years) | 45.8 | N/A |
| Year 9 (age 13 to 14 years) | 42.2 | N/A |
| Year 10 (age 14 to 15 years) | 42.0 | N/A |
| Year 11 (age 15 to 16 years) | 38.9 | N/A |
| All primary school age (age 4 to 11 years) | 57.4 | 62.5 |
| All secondary school age (age 11 to 16 years) | 43.6 | N/A |
| All school age children (age 4 to 16 years) | 51.7 | N/A |
Figure 32. Percentage influenza vaccine uptake for children in school years reception to year 6 (age 4 to 10 rising to 11 years old) (primary school age), collected between 1 September 2021 to 31 January 2022
Overall vaccine uptake for all children of school age reception to year 11 (age 4 to 16 years old) by local authority (LA) (not shown here) ranged from 27.0% (15,291 out of 56,702) in Leicester to 72.3% (47,992 out of 66,346) in North Yorkshire. Uptake by year group and LA ranged from:
- 28.1% to 75.2% in reception
- 32.2% to 83.7% in year 1
- 32.8% to 85.5% in year 2
- 32.4% to 77.8% in year 3
- 32.1% to 79.8% in year 4
- 31.1% to 76.9% in year 5
- 30.3% to 77.3% in year 6
- 20.4% to 74.7% in year 7
- 19.8% to 70.5% in year 8
- 18.7% to 67.3% in year 9
- 17.6% to 67.3% in year 10
- 13.6% to 70.6% in year 11
Further detail on final influenza vaccine uptake data in all cohorts in England is now publicly available.
Scotland
As previously described, the uptake of seasonal influenza vaccine in children is estimated by PHS throughout the season, using a combination of: (i) aggregated data returns submitted by staff in all the territorial NHS boards on a weekly basis for those eligible in the following cohorts: 6 months to 2 years at risk, 2 to 5 years not at school, primary and secondary school pupils and (ii) weekly extracts of data downloaded from the national clinical data store (NCDS) which contains individual-level data relating to the childhood schools’ and nurseries’ programmes for one NHS board.
The estimated uptake in pre-school children (2 to under 5 year olds, not yet in school) was 57.2%. This compares with 63.0% and 52.5% in 2020 to 2021 and 2019 to 2020, respectively. The influenza vaccination programme in primary school-aged children in Scotland continues with an estimated uptake of 74.6% in 2021 to 2022.
The offer of influenza vaccine was extended to young people in secondary schools for the first time in 2021 to 2022, there was an estimated uptake of 62.1%.
Wales
In Wales, immunisations for 2 and 3 year olds were delivered through general practices, apart from one health board where the majority of 3 year olds were immunised through nursery school immunisations sessions (uptake in these nursery school sessions was 61.9%).
National uptake of influenza vaccine in 2 and 3 year olds decreased in 2021 to 2022. Uptake of influenza vaccine for children aged 2 years was 48.2% (compared to 54.7% in 2020 to 2021), for 3 year olds it was 47.0% (compared to 57.8% in 2020 to 2021).
For the whole group of children aged 2 and 3 years, uptake was 47.6% (compared to 56.3% in 2020 to 2021).
The childhood influenza programme in Wales includes all primary and secondary school children up to school leaving age. Uptake in primary school children decreased. Children aged 4, 5, 6, 7, 8, 9 and 10 years received their vaccinations in school immunisation sessions and uptake was 67.5%, 69.5%, 69.7%, 69.1%, 69.2%, 68.2% and 67.8% in each of these groups respectively.
For the group as a whole, uptake was 68.7% (compared to 72.4% in 2020 to 2021). In secondary school, children aged 11, 12, 13, 14 and 15 years, received their vaccination in school immunisation sessions and uptake was 64.7%, 60.2%, 58.0%, 54.9% and 52.9% in each of these groups respectively. For the group as a whole, uptake was 58.2%.
Northern Ireland
In 2021 to 2022 the childhood influenza vaccination programme continued to include all pre-school children aged 2 to 4 years old and all primary school aged children. The former group were offered vaccination through primary care, with the latter group offered vaccination through school health teams.
The vaccination uptake rate in 2021 to 2022 for pre-school children aged 2 to 4 years old was 24.4% (compared to 55.2% in 2020 to 2021). The vaccination uptake rate for children in primary school (aged approximately 4 to 11 years old) was 72.7% (compared to 73.1% in 2020 to 2021).
In 2021 to 2022, Northern Ireland expanded the vaccination programme from all year 8 children (introduced in 2020 to 2021) to include secondary school children (years 8 to 12) with an uptake rate of 64.2%. These year groups were vacinated through school clinics.
Caution should be used when considering the 2021 to 2022 influenza vaccination uptake rates in pre-school children in comparison to previous seasons, due to the introduction of the new VMS involving new methods of recording and extracting influenza vaccine data.
Influenza vaccinations administered by Trust School Nursing teams are recorded in the Child Health System (CHS), similar to previous seasons.
Vaccine effectiveness
In the 2021 to 2022 season, as in previous seasons, influenza VE was measured using a test-negative design (TND) study. VE was measured for the first time against influenza in those requiring ED visits rather than patients in primary care.
Infection and attendance data were collected through the Respiratory DataMart surveillance scheme and the Emergency Care Data Set (ECDS). Vaccination status of study participants was obtained through data linkage with the National Immunisation Management Service (NIMS).
In adults aged 50 years and over, the provisional overall adjusted influenza vaccine effectiveness (aVE) in 2021 to 2022 was 26% (95% confidence interval (CI) 5% to 43%) against all laboratory confirmed influenza. Protection against influenza A(H1N1)pdm09 was good with an aVE of 76% (95% CI: 30% to 92%), but lower against influenza A(H3N2) (aVE 28%, 95% CI -3% to 50%) (Table 6).
Estimates by vaccine type were broadly similar with overlapping confidence intervals. Moderate aVE was observed for the cell-based quadrivalent vaccine (QIVc) of 39% (95% CI 5% to 61%) which was offered to the 50 to 64 year old cohort.
In children aged 1 to 17 years, the provisional overall aVE in 2021 to 2022 was 73% (95% CI 53% to 84%) against all laboratory confirmed influenza. For LAIV specifically, the aVE was 72% (50% to 85%).
Final end-of-season results with further breakdowns will be published in a peer-reviewed journal article later this year.
Table 6: Adjusted influenza vaccine effectiveness against ED attended laboratory confirmed influenza by influenza and vaccine type in 50 year olds and over, 2021 to 2022, England
| Influenza type | Adjusted Vaccine Effectiveness aVE (95% Confidence Interval) |
|---|---|
| A(H1N1)pdm09 | 76% (30 to 92) |
| A(H3N2) | 28% (-3 to 50) |
| All | 26% (5 to 43) |
| Vaccine type | Adjusted Vaccine Effectiveness aVE (95% Confidence Interval) |
|---|---|
| QIVc | 39% (5 to 61) |
| QIVe | 33% (-18 to 61) |
| aQIV | 21% (-6 to 41) |
| Unknown vaccine type | 27% (-8 to 50) |
| All aVE | 26% (5 to 43) |
Figures adjusted for vaccination in 2020 to 2021 season, month of sample, age group, sex, UKHSA region, indices of multiple deprivation quintile, clinically extremely vulnerable flag, ethnicity, and COVID-19 vaccination status.
Emerging respiratory viruses
MERS-CoV infections
Since WHO first reported cases of MERS-CoV in September 2012, a total of 2,585 laboratory confirmed cases have been reported globally up to 10 April 2022. This includes 892 fatal cases (case fatality ratio of 35%).
In the most recent reporting period between week 40 2021 and week 14 2022, 7 cases have been reported globally by WHO. The majority of these cases have occurred in countries in the Arabian Peninsula. A feature of MERS-CoV is its ability to cause large outbreaks within healthcare settings.
Local secondary transmission following importation has been reported from several countries including the UK, France, Tunisia, and the Republic of Korea.
A total of 5 (1 in 2012, 3 in 2013 and 1 in 2018) confirmed MERS-CoV cases have been reported in the UK since 2012. This includes 2 secondary cases with non-sustained transmission in the UK linked to the second imported UK case in January 2013.
In April and May 2014, 2 laboratory confirmed cases transited through London Heathrow Airport on separate flights to the USA. Contact tracing of flight contacts did not identify any further cases (3).
UKHSA remains vigilant, closely monitoring developments in countries where new cases emerge and continues to work with international colleagues to assess whether recommendations need to change in relation to MERS-CoV.
Further information from UKHSA on the investigation and management of possible cases is available online (4).
Human influenza A(H7N9) infections
Since the first human infections with avian influenza A(H7N9) were reported in China through WHO in April 2013, up to 4 May 2022 1,568 cases have been reported, including[at least 616 deaths giving an overall case fatality ratio of 39.3%.
The last case of A(H7N9) was reported in 2019. The risk of influenza A(H7N9) infection to UK residents in the UK remains very low.
Information from UKHSA including advice on clinical management is available on GOV.UK.
Human influenza A(H5N1) and influenza A(H5N6) infections
Since 2003 and up to 7 April 2022, 864 human cases of avian influenza A(H5N1) have been reported worldwide including 456 deaths, giving an overall case fatality rate of 52.8%.
On 6 January 2022 UKHSA notified WHO of the detection of a laboratory confirmed human case of avian influenza A(H5) from south west England, which later tested positive for influenza A(H5N1). The case was exposed to domestically kept birds with confirmed infection with avian influenza A(H5N1) and was the first reported case of human infection in the UK, with no evidence of secondary transmission identified.
Since 2021 there has been an increase in detections of influenza A(H5N6) in humans, with up to 78 laboratory-confirmed cases of human infection from 2014 to 10 April 2022, in China and Lao People’s Democratic Republic. In 2021, 32 cases were reported by WHO, 31 from China and 1 from Laos. So far in 2022 up to 10 April 2022, WHO have reported 19 cases from China.
The increase in reports of human cases of infection may reflect the circulation of the virus in birds, as well as enhanced surveillance and diagnostic capacity since the COVID-19 pandemic.
Human influenza A(H9N2)
Since 2021 there has been an increase in detections of influenza A(H9N2) in humans, with up to 85 laboratory-confirmed cases of human infection from 2015 to 24 March 2022. In 2021, 22 cases were reported by WHO, 21 from China and 1 from Cambodia.
So far in 2022 up to 10 April 2022, WHO have reported 13 cases from China and 1 case from Cambodia. Avian Influenza A(H9N2) has been mainly reported from mainland China.
Other cases have been reported in other countries including Bangladesh, Pakistan, Oman, Senegal and Egypt. The majority of human cases of Avian Influenza A(H9N2) have reported exposures to avian species such as backyard poultry or live poultry markets.
Avian influenza summary
Most human cases of avian influenza viruses are exposed through contact with infected poultry or contaminated environments, including live poultry markets or domestically kept birds. Since the viruses continue to be detected in animals and environments, further human cases can be expected.
Even though small clusters of H5N1 and H7N9 virus infections have been reported, current epidemiological and virological evidence suggests that these viruses have not acquired the ability to undergo sustained transmission amongst humans.
It is important to ensure that imported cases of suspect avian influenza are detected promptly to ensure public health measures including infection control can be rapidly put in place to minimise any risk of onward transmission.
There have been multiple detections of avian influenza in avian species in the UK in 2021 to 2022 as reported by DEFRA.
Information on recent acute public health events or potential events of concern including avian influenza can be found on WHO Disease Outbreak News.
Conclusions
Influenza activity remained low through the majority of the 2021 to 2022 influenza season, with activity higher than that of 2020 to 2021 but lower than that of previous seasons. Slight increases in activity were observed through several indicators in late 2021, before declining likely as a result of government and personal non-pharmaceutical interventions to reduce the transmission of the SARS-CoV-2 omicron variant.
From around week 8 of 2022, increases in influenza were noted in several indicators, representing late-season activity. Despite this increase, activity overall remained low.
Influenza-like illness consultation rates remained far below the baseline and much lower than levels seen in seasons prior to the COVID-19 pandemic across the UK, with rates mostly lower than even those observed in the inter-seasonal periods in many previous years.
Hospital admissions for confirmed influenza also remained below baseline levels for the majority of the season, reaching slightly above baseline in only week 12 and week 14. Admissions to ICU and HDU remained low and below baseline throughout the season.
Detections of influenza through Respiratory DataMart were higher than in 2020 to 2021, however remained significantly lower than the levels observed in seasons prior. Again, although low overall, late-season activity was observed through this indicator.
Other countries in the Northern Hemisphere also observed similar general trends, with late-season activity and overall activity being higher than levels observed in 2020 to 2021, but lower than pre-pandemic seasons, including across Europe, Canada and the US.
A contributing factor to the particularly low influenza activity seen in 2020 to 2021 is the many non-pharmaceutical interventions put in place to control the spread of SARS-CoV-2, which has in turn led to lower influenza transmission.
In 2021 to 2022, influenza activity was overall higher than the previous season but lower than that of pre-pandemic seasons. Social contact rates remained below those observed prior to the COVID-19 pandemic (5).
Influenza vaccine uptake in 2021 to 2022 varied across the UK. In England, vaccine uptake in those aged 65 years and over was the highest ever achieved, however was lower than last season in other cohorts. In Scotland, vaccine uptake was higher than the previous season in most reported target groups although some of the data is not comparable to previous seasons.
In Northern Ireland, uptake should be interpreted with caution due to the introduction of the new VMS. Reported uptake was lower than during the 2020 to 2021 season in those aged over 65 and in pregnant women. In Wales, uptake was higher than last season in those aged 65 years and over.
The rollout of the vaccination programme to those aged 50 to 64 years old continued in 2021 to 2022, after first being offered during the 2020 to 2021 season dependent on vaccine supply.
The roll out and expansion of the childhood LAIV programme which was first implemented in the 2013 to 2014 season, continued across the UK. The programme targeted eligible pre-school cohorts and all children in primary school in the UK, and for the first time, all children in secondary school up to school leaving age.
Vaccine uptake in children was generally slightly lower in the 2021 to 2022 season compared to the 2020 to 2021 season, across the UK.
Surveillance continues in the UK for other respiratory viruses, as well as novel respiratory viruses including MERS-CoV and avian influenza viruses such as influenza A(H7N9), influenza A(H5N1) and influenza A(H5N6), with risk assessments being updated regularly.
Acknowledgements
Compiled by the Influenza surveillance section, Immunisation and Vaccine-Preventable Diseases Division, UK Health Security Agency with contributions from:
- Public Health Scotland
- Public Health Wales
- Public Health Agency, Northern Ireland
- Royal College of General Practitioners
- Real-time Syndromic Surveillance team, UKHSA
- Co- and secondary infections team, UKHSA
- Respiratory Virus Unit, Colindale, UKHSA
References
1. Vega, T and others. ‘Influenza surveillance in Europe: establishing epidemic thresholds by the moving epidemic method’. Influenza Other Respiratory Viruses, 2013. 7(4): pages 546 to 58
2. Lampos, V and others. ‘Advances in nowcasting influenza-like illness rates using search query logs’. Scientific Reports, 2015. 5: page 12760
3. Parry-Ford, F and others. ‘Public health response to two incidents of confirmed MERS-CoV cases travelling on flights through London Heathrow Airport in 2014 – lessons learnt.’ Eurosurveillance, 2015
4. MERS-CoV: public health investigation and management of possible cases, UKHSA
5. Gimma, A and others. ‘Changes in social contacts in England during the COVID-19 pandemic between March 2020 and March 2021 as measured by the CoMix survey: A repeated cross-sectional study’. PLOS Medicine, 2022